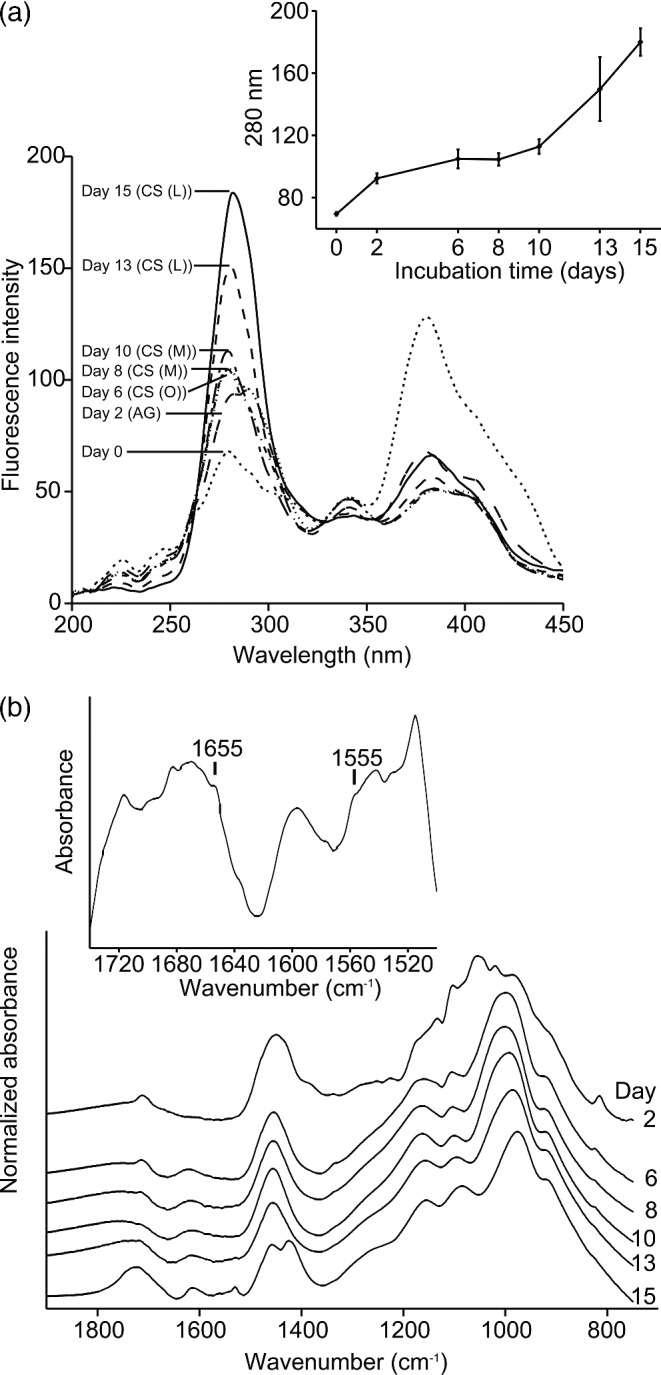
Figure 2.

Analysis of compounds released into the medium during C-starvation. (a) Synchronous fluorescence spectroscopy. Inset shows the intensity change of the peak at 280 nm (n = 3, bars indicate SE). (b) FTIR-ATR spectroscopy. Inset shows the difference spectrum: spectrum (day 15)–spectrum (day 13). (AG) denotes the active growth phase; CS (O), the onset of the C-starvation; CS (M), the medium C-starvation phase; CS (L), the late C-starvation phase.
