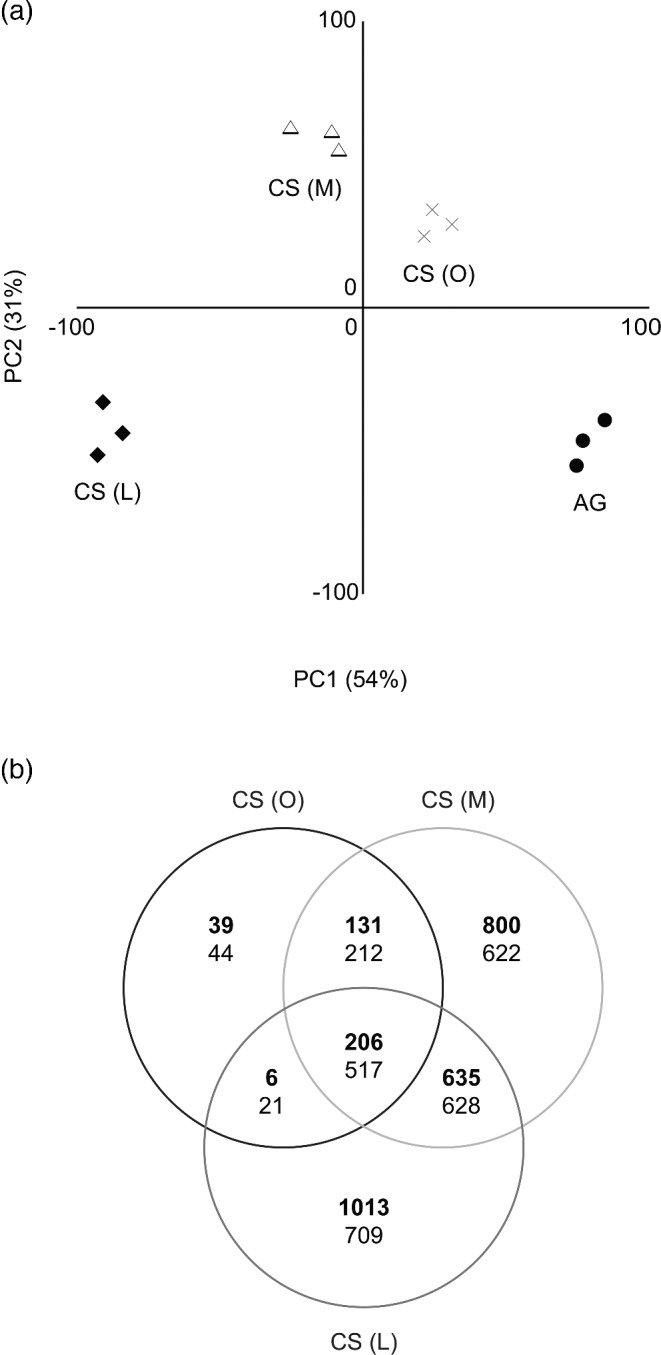
Figure 4.

Transcriptional response during C-starvation in P. involutus. (a) PCA plot of the expression levels. The analysis was performed on the expression levels (log2 normalized) of 7677 transcripts out of 12 214 that had a false discovery rate q ≤ 0.01 (n = 3, f-test). Each point in the PCA represents a replicate from one of the different growth phases: active growth phase (AG, day 2), onset of C-starvation (CS (O), day 6), after 2 days (CS (M), day 8), and 7 days (CS (L), day 13) of starvation. (b) Venn diagram showing the number of upregulated transcripts (bold letters) and downregulated transcripts. Differential expression was revealed by pair-wise comparisons of expression levels from the different phases of starvation (CS (O), CS (M), CS (L)) with the levels in the actively growing mycelium (AG) (q ≤ 0.01, n = 3, t-test). In total 5498 transcripts were differentially expressed during at least one of the starvation phases.
