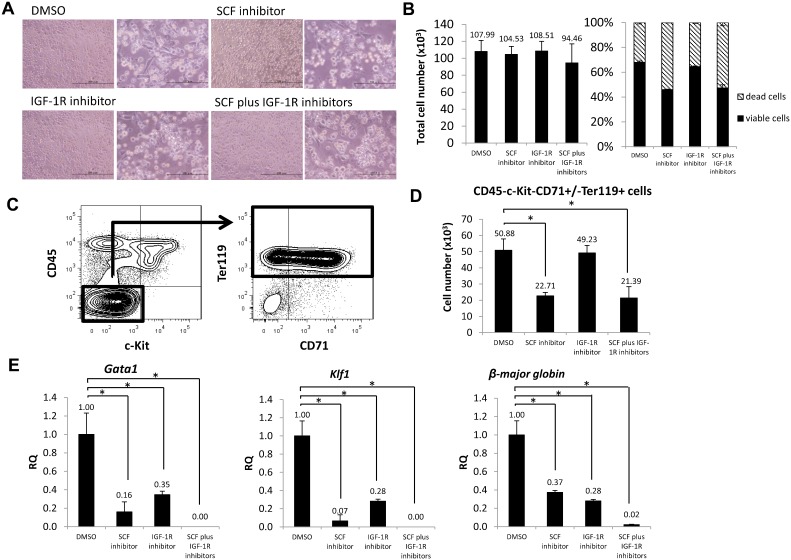
Fig. 6. SCF and IGF-1 accelerate fetal spleen erythropoiesis in vitro.
(A) Microscopic images of whole fetal spleen cell cultures after 24 hours of treatment with DMSO, an SCF inhibitor, an IGF-1R inhibitor or both. Scale bars: left, 200 µm; right, 100 µm. (B) Graphs showing the total number of cells (left) and percentage of viable and dead cells (right) in culture with those inhibitors (n = 3). (C) Gating strategy of flow cytometric analysis. CD45−c-Kit−CD71+/−Ter119+ defines terminally-differentiating erythroid cells and mature red blood cells. (D) Graph showing the number of terminally-differentiating erythroid cells and mature red blood cells in culture with DMSO, the SCF inhibitor, the IGF-1R inhibitor or both (n = 3). (E) Expression of erythroid mRNAs such as Gata1, Klf1 and β-major globin in sorted CD45− cells by real-time PCR. CD45− cells from DMSO-treated cultures served as controls (n = 3). Data are means±standard deviation (SD). *P<0.05.

