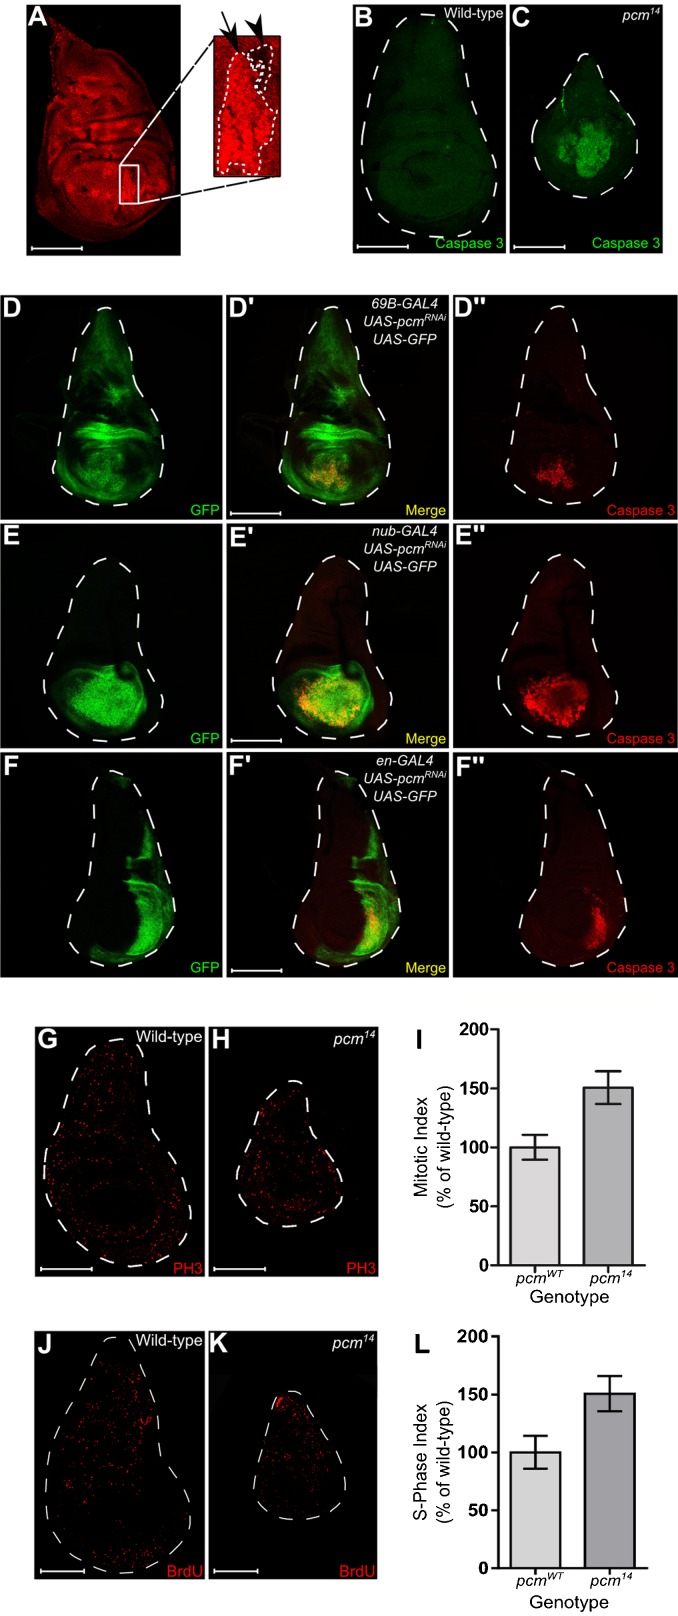
Fig. 6. Populations of pcm14 cells have reduced growth compared to populations of wild-type cells as a result of an increase in apoptosis.
(A) Mosaic analysis was performed to directly compare growth rates between wild-type and pcm14 mutant cells. Background cells are pcmWT/pcm14, cells increased in fluorescence are pcmWT/pcmWT and cells with no fluorescence are pcm14/pcm14. Mutant clones (arrowhead) were significantly smaller than their wild-type twin spots (arrow) (n = 25). The boundaries of wild type and mutant clones are marked by a white dashed line. Wild-type and pcm14 wing imaginal discs were stained with an antibody for activated Caspase 3 which labels cells undergoing apoptosis. Cells throughout the wing pouch of the pcm14 discs (C) were undergoing apoptosis which is not seen in wild type (B) (n≥39). Knockdown of pacman using RNAi driven by (D–D″) 69B-GAL4, (E–E″) nub-GAL4 or (F–F″) en-GAL4 caused apoptosis to occur specifically within the wing pouch region of the disc. GFP fluorescence indicates regions of the disc expressing the UAS-pcmRNAi construct and Caspase 3 staining indicates regions of the disc where cells are undergoing apoptosis (n≥6). Note that these imaginal discs express UAS-GFP as well as UAS-pcmRNAi under the control of the relevant driver. (G,H) Wild-type and pcm14 wing imaginal discs were stained with an antibody for phosphohistone H3 which labels cells in M phase. (I) A mitotic index was calculated by dividing the number of cells in M phase by the area of the disc. The mitotic index was increased in pcm14 discs by 150% compared with wild type (n≥14, p<0.001. Error bars represent 95% confidence limits). BrdU incorporation of cells at S-phase within wild-type (J) and pcm14 wing imaginal discs (K) was visualised using an antibody for BrdU. (L) A S-phase index was calculated by dividing the number of cells in S-phase by the area of the disc. The S-phase index was increased in pcm14 discs by 154% compared with wild type (n≥8 p<0.01. Error bars represent 95% confidence limits). Scale bars represent 100 µm.

