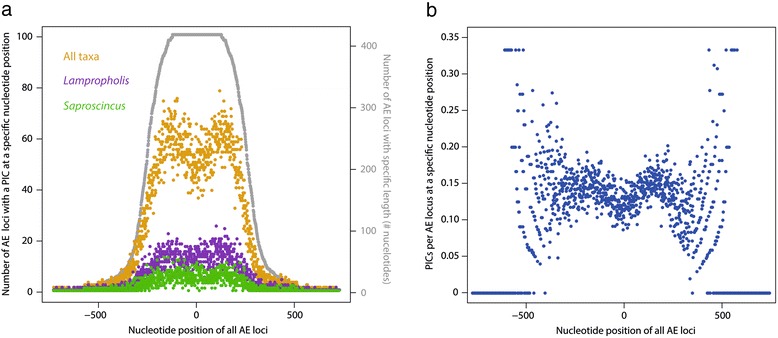
Figure 1.

The distribution of parsimony-informative characters (PICs) for anchored hybrid enrichment (AHE) markers. a) The distribution of parsimony-informative characters (PICs) across the length of the 415 AHE loci for the full-taxon, Lampropholis, and Saproscincus data sets. Colored dots indicate how many total loci had at least one PIC at that nucleotide position. The zero position is the center of the anchor sequence for all loci. Grey dots indicate the distribution of locus length by plotting number of loci (right y-axis) with any nucleotide at that position. b) The distribution of PICs across the length of the 415 AHE loci in the full-taxon data set “normalized” by dividing the number of PICs at each nucleotide position by number of alignments of that length.
