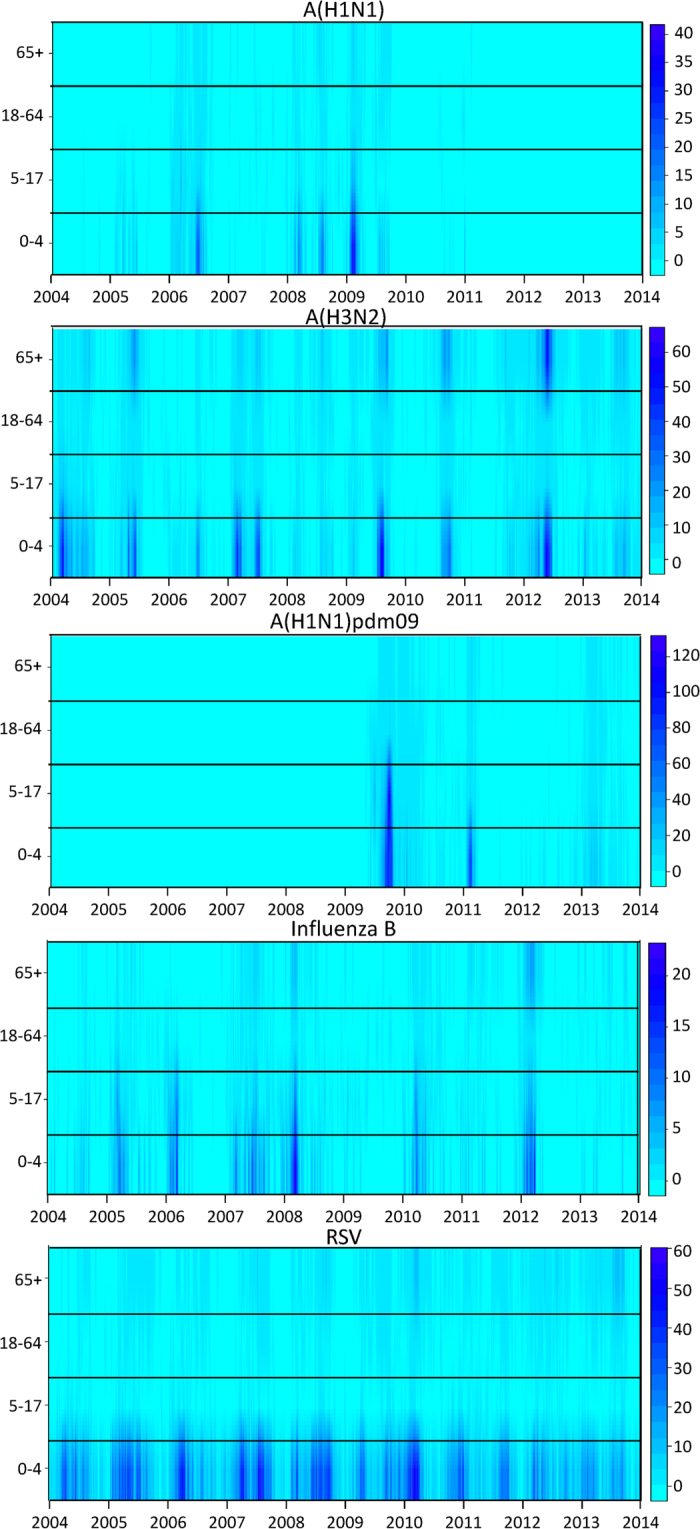
Figure 1.

Surface plot of weekly positive rates (per 100 000 population) of laboratory confirmed influenza A(H1N1), A(H3N2), A(H1N1)pdm09, influenza B and respiratory syncytial virus (RSV) by age group. The color bar on the right of each panel represents the rates range from the lowest (light blue) to highest (dark blue).
