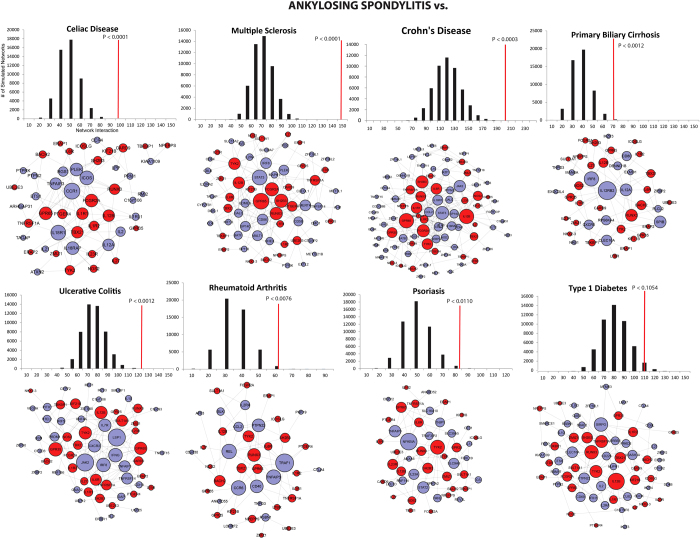
Figure 4. Gene networks associated with immune mediated diseases.
Each node represents a risk gene corresponding to AS (red node) or an immune mediated disease (blue node). The edge between the nodes represents interactions. Node size is represented by the number of edges. The top plot displays the permutation test. For each immune mediated gene set, an equal number of genes were randomly selected 50,000 times. The null distribution of the connectivity between the random set and AS gene set is plotted as a histogram (black bras) and the red line represents the original observation. The empirical p-value was computed from the permutation test.

