Figure 4.

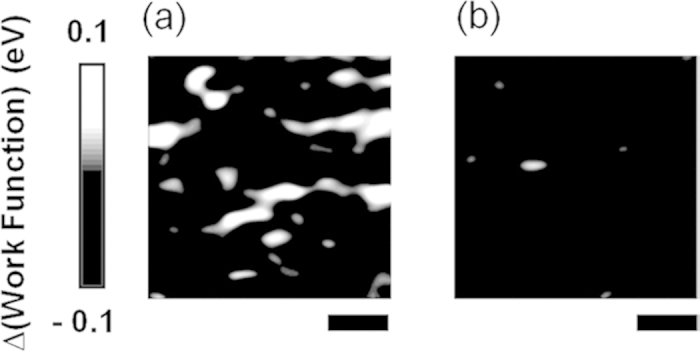
Maps of the difference in the work function (WS) at different temperatures. (a) WS(305 K)—WS(285 K) and (b) WS(355 K)—WS(285 K). The scale bar is 100 nm.

Maps of the difference in the work function (WS) at different temperatures. (a) WS(305 K)—WS(285 K) and (b) WS(355 K)—WS(285 K). The scale bar is 100 nm.