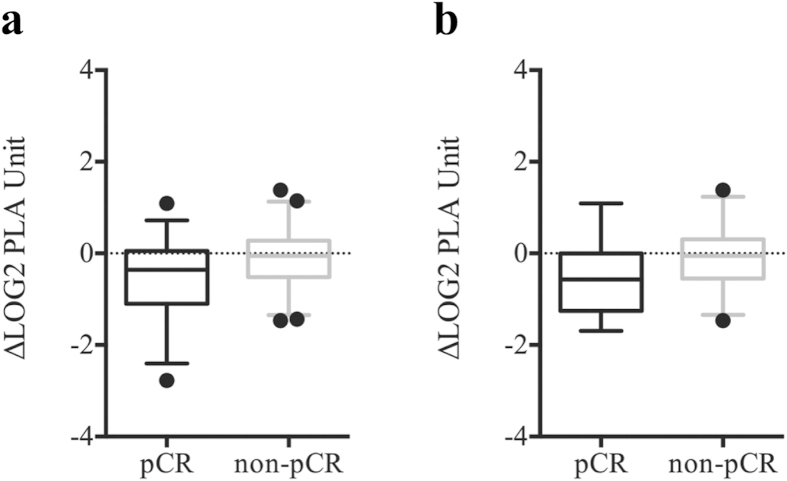
Figure 3.
Box-and-Whisker plots at the 5th and 95th percentiles of FAM84B serum protein level quantified by proximity ligation assay. (a) The changes after chemoradiation between pathological complete responders (pCR) and non-complete responders (non-pCR) (p = 0.02). (b) The changes between pCR and non-pCR groups for an independent validation cohort (p = 0.06).

