
Fig. 1.
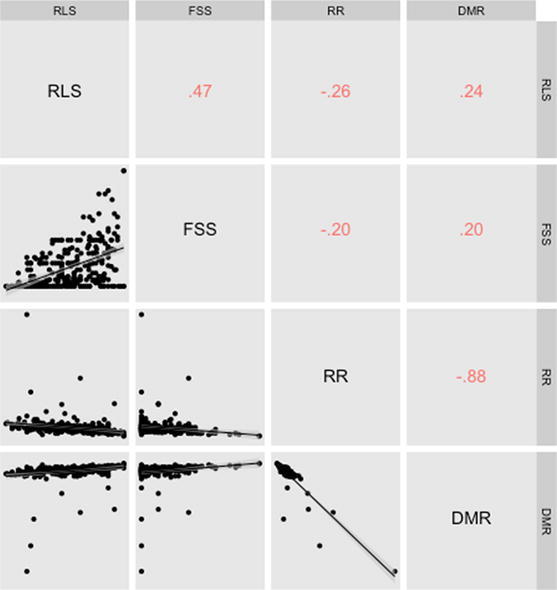
Scatter plots of pair-wise correlation of traits associated with SDS resistance. RLS root lesion severity, FSS foliar symptom severity, RR root retention (%), DMR dry matter reduction (%). The values in the scatter plot matrix represent the r values of pair-wise correlation of traits