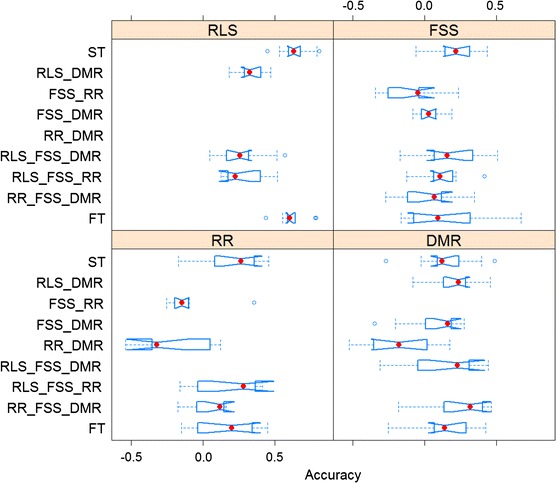
Fig. 2.

Prediction accuracy with multi-trait genomic selection (GS) models compared with single-trait GS models for four SDS resistance traits. RLS root lesion severity, RR root retention, FSS foliar symptom severity, DMR dry matter reduction, ST single-trait model, RLS_FSS model for RLS and FSS; RLS_RR model for RLS and RR; RLS_DMR model for RLS and DMR; FSS_RR model for FSS and RR; FSS_DMR model for FSS and DMR; RR_DMR model for RR and DMR; RLS_FSS_DMR model for RLS, FSS, and DMR; RLS_FSS_RR model for RLS, FSS, and RR; RR_FSS_DMR model for RR, FSS, and DMR; and FT model for all four traits. Red dot represents median of accuracies for each model. Notch marks the 95 % confidence interval for the medians. (Color figure online)
