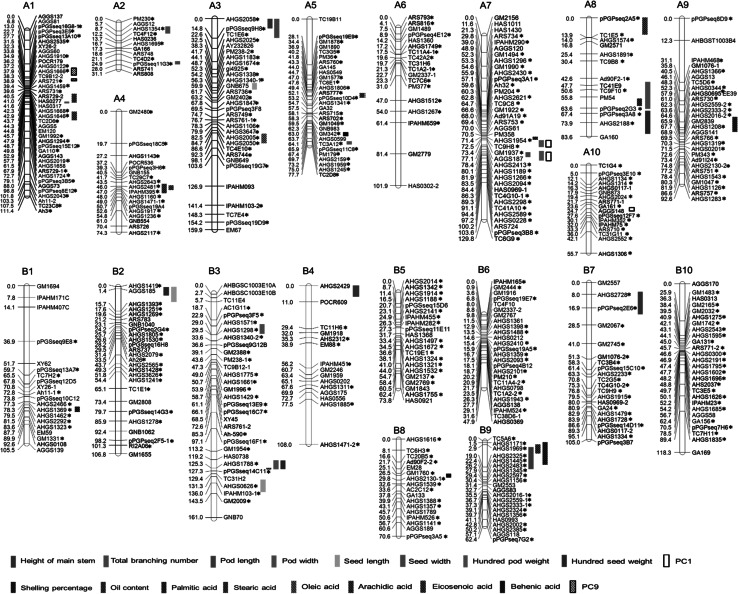
Fig. 2.
Genetic linkage map and QTL distribution of the agronomic and quality-related traits in an F 2:3 population derived from Zhonghua 10 × ICG12625. The suffix “asterisk” indicates loci with segregation distortion in F 2 generation, and the red loci are common loci for assigning linkage groups to defined chromosomes of cultivated peanut based on a comparison with the published map (color figure online)

