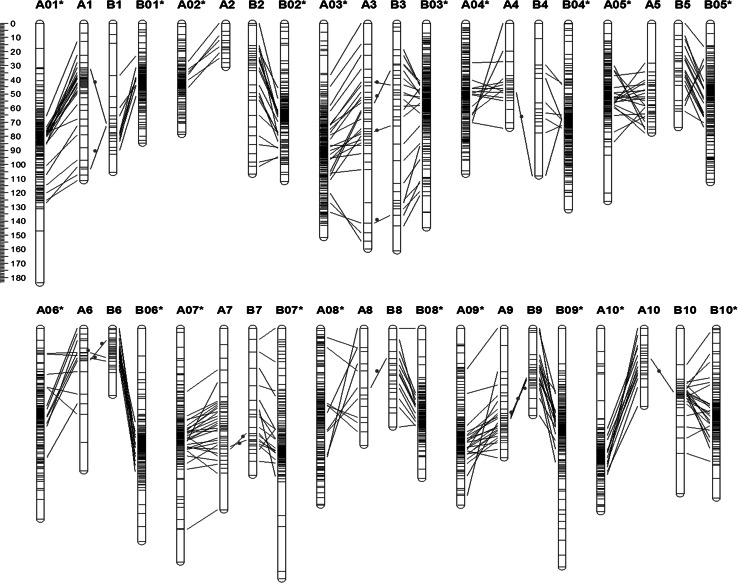
Fig. 3.
Comparison of the linkage map with the published linkage map for cultivated peanut (Shirasawa et al. 2013). The suffix “asterisk” indicates the linkage group on the published linkage map. Co-linear SSR loci between two linkage maps and homoeologous loci between the A and B genomes are indicated by black lines. Red dots highlights the homoeologous relationships between subgenomes (color figure online)

