Figure 4.

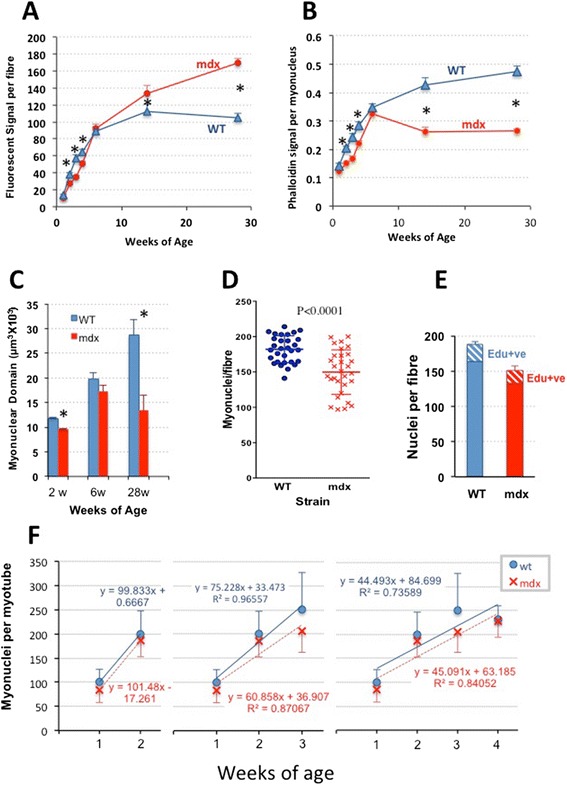
Difference between patterns of myogenesis in WT and mdx mice. (A) Fluorescent phalloidin signal per myofibre (mean ± SEM) plotted against age, illustrating the lag in mdx fibre growth in up to 6 weeks but progressive hypertrophy beyond this point (*P < 0.05). (B) The fluorescent phalloidin signal per nucleus (mean ± SEM) also increases rapidly in both mouse strains up to 6 weeks, but with mdx lagging significantly (*P < 0.05) behind WT. The subsequent continuing rise in WT fibres contrasts with the fall to half of the WT values in mdx. (C) Column plot of the estimated myonuclear domains in muscle fibres isolated from muscles of 2-, 6- and 28-week WT and mdx mice (mean ± SEM, *P < 0.05). (D) Scatterplots, together with depiction of mean ± SD, of myonuclear number per myofibre isolated from 18-day-old WT and mdx mouse EDL muscles. (E) EDL fibres from mice labelled with EdU at 14, 15 and 16 days of age and analysed on day 18 showing similar labelling frequencies of fibre-associated nuclei (new-formed myonuclei plus Pax7-positive satellite cells). (F) Nuclear number/fibre (mean ± SD) of fibres isolated from muscles of mdx and WT mice at weeks 1 to 4. The successive incremental plots show a progressive fall in slope from 100 nuclei/fibre between weeks 1 and 2 to a net rise of approximately 45 nuclei per fibre averaged across weeks 1 to 4. Cessation of WT growth is evident beyond week 3. Myonuclei numbers in mdx fibres fall consistently below those of WT fibres, but the plots run largely parallel suggesting that the intensity of myogenesis in the two strains is closely similar and that the mdx fibres had fallen behind WT during prenatal development.
