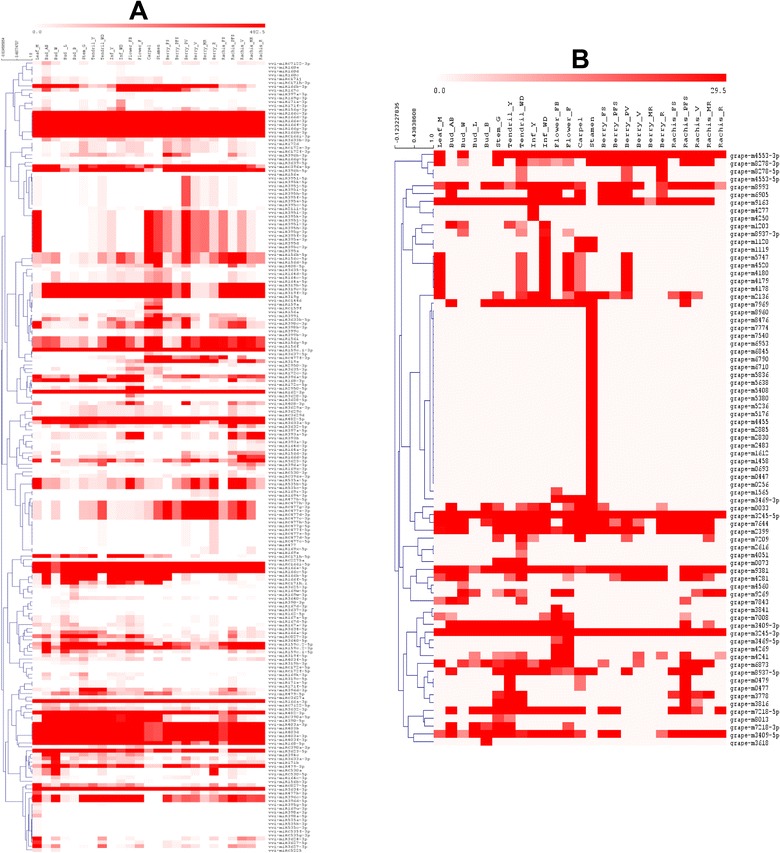
Fig. 6.

Heat map and hierarchical cluster analysis (HCL) of miRNAs identified in Corvina derived libraries. The HCL tree was generated with the average linkage clustering method. A: Heat map with known miRNAs including new members of known families. B: Heat map with novel miRNAs. miRNAs with an abundance below the set threshold of 10 TP5M in both replicates were set to zero. miRNAs that are zero in all the 25 samples were removed from these heat maps. Red and white represent high and low expression, respectively
