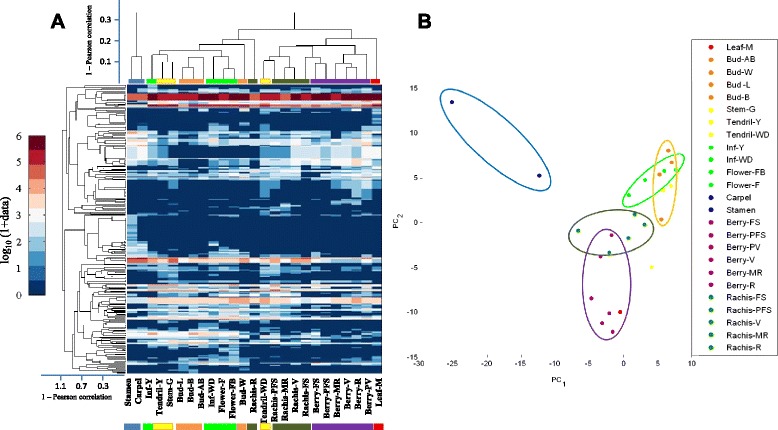
Fig. 7.

Clustergram and principal component analysis of the 25 different grapevine samples of the miRNA atlas. (A) The picture reports the hierarchical clustering analysis for both samples and miRNAs, the corresponding dendrogram and the data heat map. Data were normalized as described in Methods. The X-axis of each dendrogram is the 1 minus Pearson correlation distance metric. We used an optimal leaf order value which determines the leaf order that maximizes the similarity between neighbouring leaves. (B) A PCA analysis has been performed on the dataset. Data were preliminarily z-scored. X-axis represents the first components and the Y-axis the second component. The two components explain 34.5% of total variance. Each organ is associated to the same colour and ovals indicate clusters approximately related to organ identity. Blue for reproductive organs, purple for berries, red for leaf, orange for buds, yellow for stem and tendrils, light green for inflorescences and dark green for rachis. The same colours are used in the dendrogram. Each color represents a different cluster. One minus Pearson correlation was used as a metric distance
