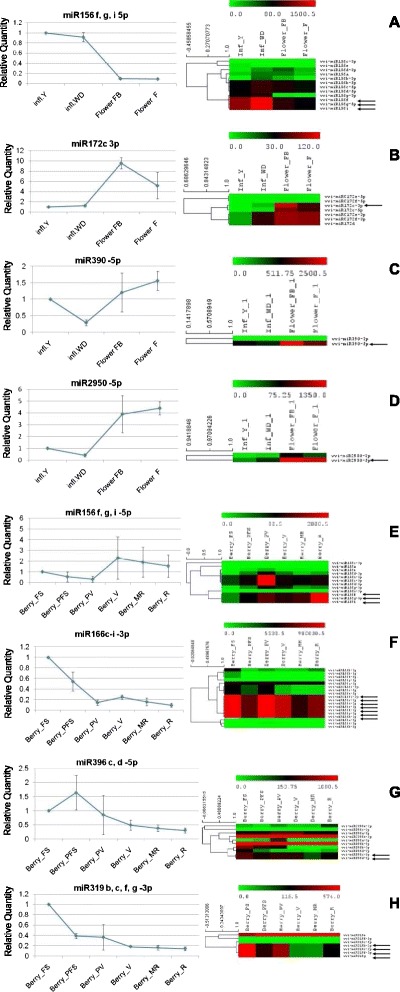
Fig. 9.

Real-Time PCR validation of deep sequencing data. Bars: standard error of the averages of each replicate. Heat maps on the right of each Real-Time graph refer to deep sequencing data. All the members of a given family are shown in heat maps, comprising 5p and 3p sequences. miRNAs tested by Real-Time PCR are indicated by an arrow. Panels A-D: miRNAs tested in the inflorescences/flowers samples; Panels E-H: miRNAs tested in the berries samples
