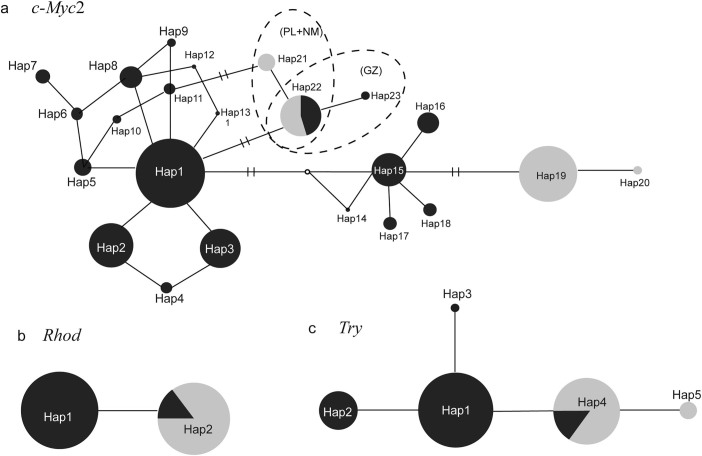
Figure 3. Median-joining networks for haplotype relationships of (a) c-Myc2, (b) Rhod and (c) Tyr in N. parkeri.
The haplotypes and their frequencies are labeled. The black and grey colours represent the populations from eastern and western regions, respectively (Table 1). Network branches linking the cycles indicate one mutation step; two or more mutations are represented by slashes crossed with the network branches. The small open circle represents hypothetical missing intermediate.

