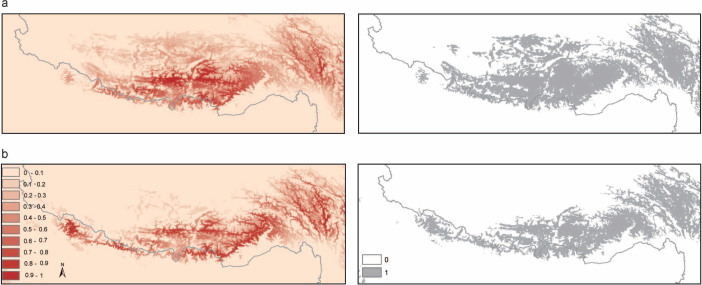
Figure 4. Predicted species distributions of N. parkeri under (a) current conditions, and (b) LGM conditions estimated from the CCSM climate models.
The right column indicates the suitable (1) and unsuitable (0) habitats by thresholds of the mean maximum training sensitivity plus specificity. The maps were produced using ArcGIS v10.1 (ESRI, CA, USA) and Adobe Illustrator CS5 v15.0.0 (Adobe Systems Inc., San Francisco, CA).

