
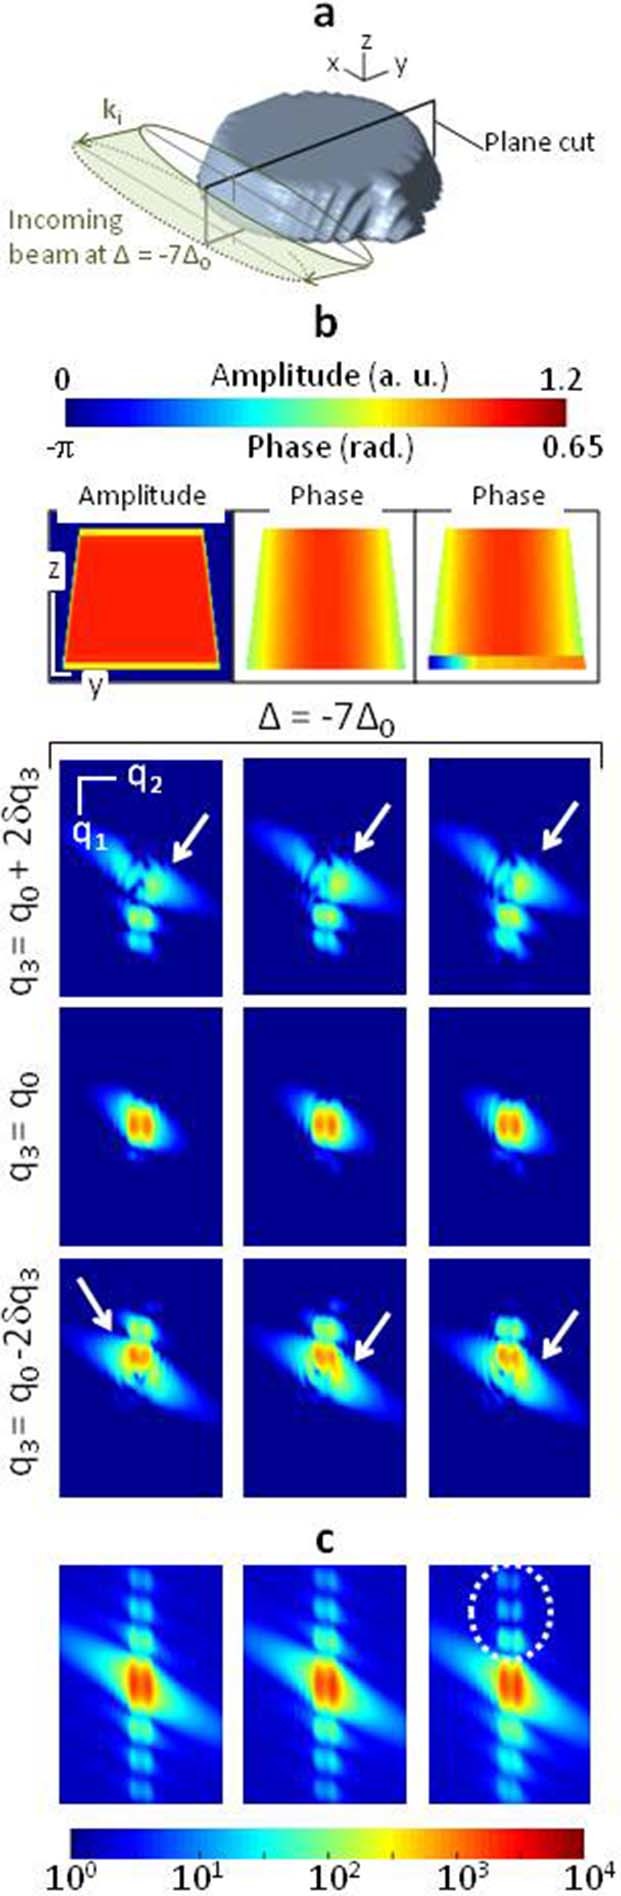
Figure 4. Presence of a crystalline displacement field: numerical studies.
Estimation of the expected diffraction patterns calculated for different 3D
strained crystals with shape similar to the SOI structure. (a) Common 3D
iso-surface rendering of the synthetic object together with the incoming
beam shape (FWHM of intensity) for  . The laboratory frame is given; the length of the black lines is
100 nm. (b) Three synthetic models, corresponding to three different strain
states and their corresponding diffraction patterns. The 2D sample
description is shown in the plane indicated in (a) while the diffraction
patterns are taken at the same
. The laboratory frame is given; the length of the black lines is
100 nm. (b) Three synthetic models, corresponding to three different strain
states and their corresponding diffraction patterns. The 2D sample
description is shown in the plane indicated in (a) while the diffraction
patterns are taken at the same  and
and  values as the ones of (Figure 2, left column). (c) Intensity integrated along
the
values as the ones of (Figure 2, left column). (c) Intensity integrated along
the  direction, for the same
  value. The specific features of
the calculated diffraction patterns are emphasized by the white arrows and
the dotted ellipse. The three strain states are as followed: (Left)
The 3D strain-free crystal case. A 2D cut through the 3D amplitude is shown
in (a). Note the assymetry in the spatial scale, which is underlined by the
white lines, representing a 100 nm length. (Middle) Same calculation,
obtained for a strained crystal: a displacement field with a radial symmetry
is introduced at the edge of the structure. A 2D cut through the
corresponding sample phase is shown at the top. (Right) Same as
before with the simultaneous introduction of the displacement field at the
edges and at the interface. This last model produces diffraction patterns in
good agreement with the experimental ones.
value. The specific features of
the calculated diffraction patterns are emphasized by the white arrows and
the dotted ellipse. The three strain states are as followed: (Left)
The 3D strain-free crystal case. A 2D cut through the 3D amplitude is shown
in (a). Note the assymetry in the spatial scale, which is underlined by the
white lines, representing a 100 nm length. (Middle) Same calculation,
obtained for a strained crystal: a displacement field with a radial symmetry
is introduced at the edge of the structure. A 2D cut through the
corresponding sample phase is shown at the top. (Right) Same as
before with the simultaneous introduction of the displacement field at the
edges and at the interface. This last model produces diffraction patterns in
good agreement with the experimental ones.