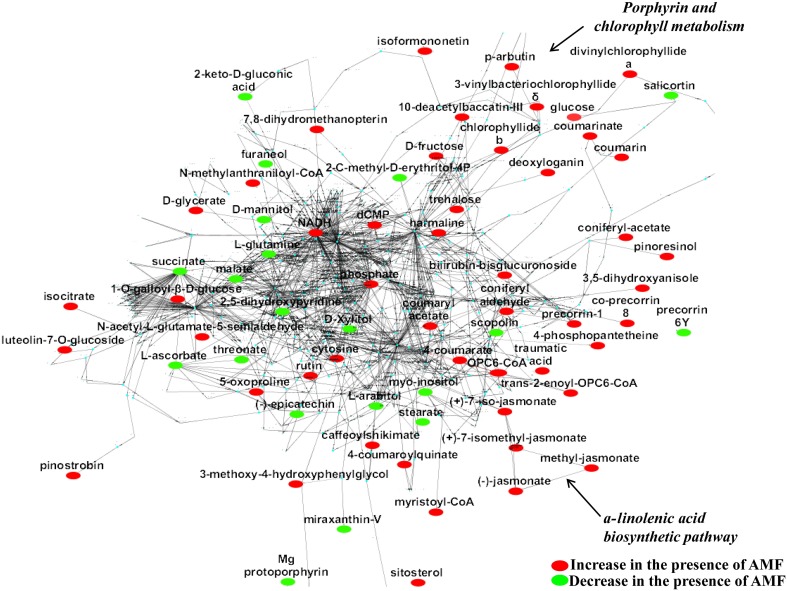
Figure 3.
The global willow leaf metabolic network and its perturbation 2 weeks following inoculation with the AMF Rhizophagus irregularis visualized using the software Cytoscape. Biomarkers of the symbiosis and possible interconnecting networks between them are displayed. Sections of the a-linolenate biosynthetic pathway and porphyrin and chlorophyll metabolism are indicated by arrows. Metabolite fluctuations are displayed using a color code based on P-values (P < 0.05) performing the Student's t-test.

