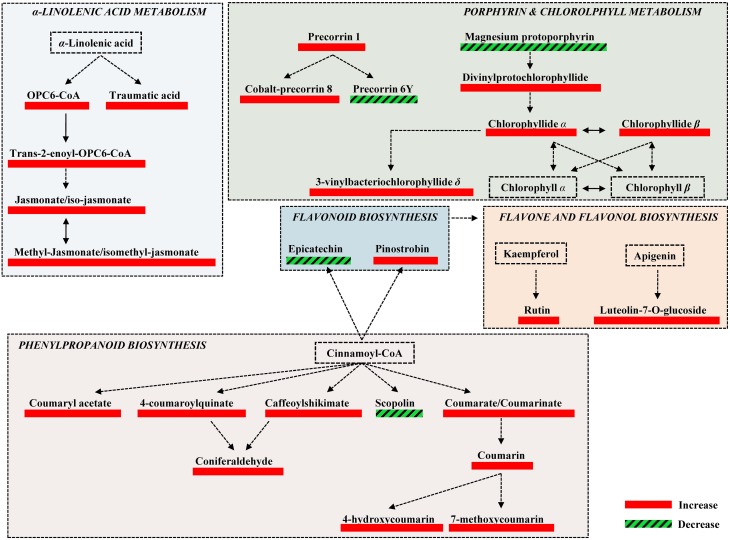
Figure 4.
Fluctuations of major biosynthetic pathways of willow leaves 2 weeks post-inoculation with the AMF Rhizophagus irregularis infection based on changes in the relative concentration of identified metabolites. Metabolite fluctuations are displayed using a color code based on P-values (P < 0.05) performing the Student's t-test. Five biological replications and a quality control sample were analyzed per treatment. Dashed lines symbolize multi-step or not fully elucidated reactions and solid lines one-step reactions.

