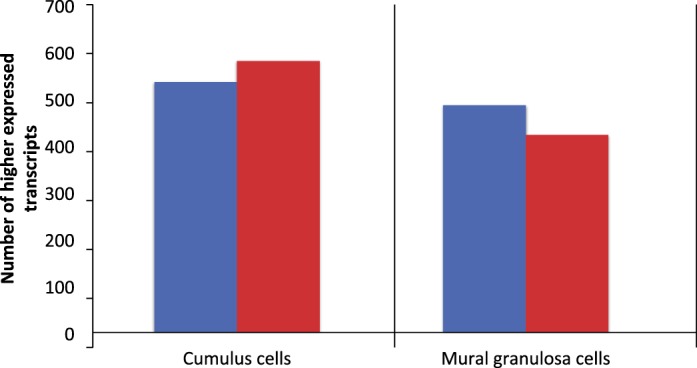
FIG. 2.

Number of transcripts expressed at higher levels in SAFs of unstimulated ovaries (blue bars) versus those of LAFs 44 h post-eCG-stimulation (red bars) in cumulus cells or MGCs. Only transcripts that encode proteins with annotated biological functions are included.
