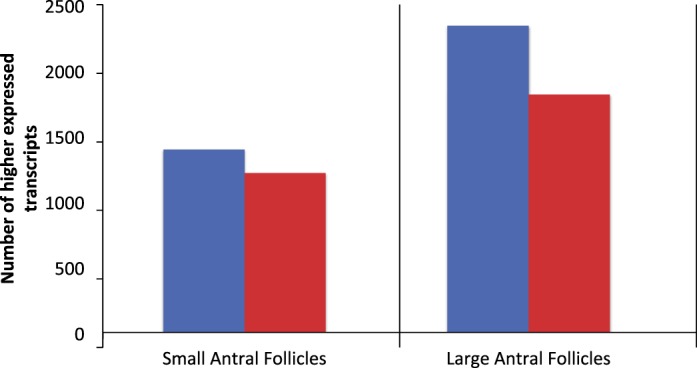
FIG. 4.

Number of transcripts expressed at levels higher in cumulus cells versus MGCs (blue bars) or higher in MGCs versus cumulus cells (red bars). Samples were taken from the SAFs of 22-day-old mice or the LAFs of 22-day-old mice 44 h poststimulation with eCG. Only transcripts that encode proteins with annotated biological functions are included.
