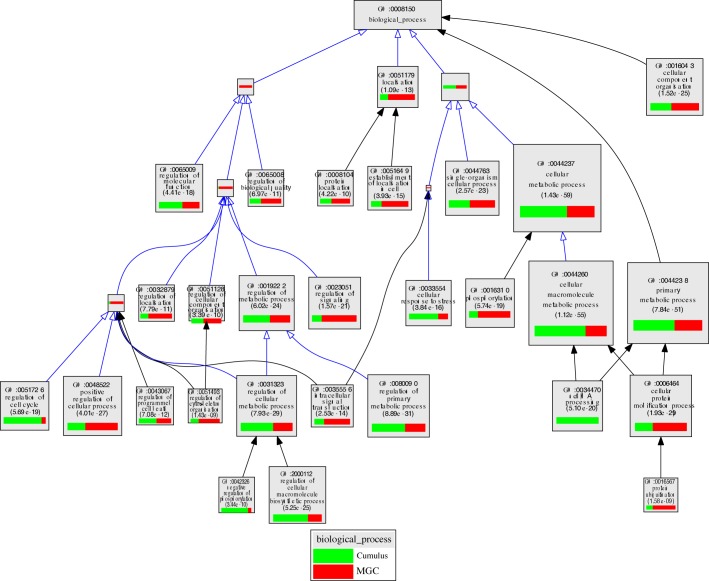
FIG. 6.
VLAD depiction of GO terms in the contrast of cumulus cells versus MGCs from LAFs. The top 25 GO terms, selected by VLAD on the basis of local maximum P value, are shown. The size of the rectangle is proportional to the P value; the larger the rectangle the lower, and more significant, is the P value. The green portion of the rectangle shows the relative contribution of cumulus cell transcripts from LAFs to that GO term while the red portion shows the relative contribution of transcripts from LAFs. Supplemental Table S4 presents a complete list of transcripts expressed differently in SAFs and LAFs for each GO term.

