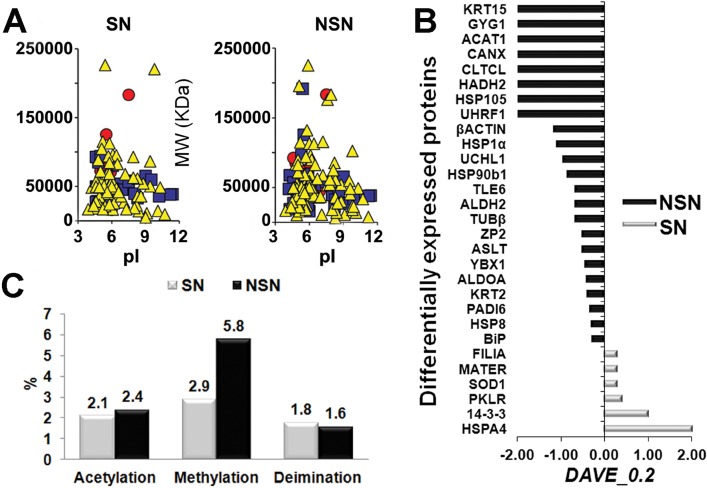
FIG. 2.
Proteomic profile on 300 oocytes/type reveals the up-regulation of several proteins in the NSN oocytes together with a higher number of peptide modifications. A) Two-dimensional map of SN and NSN oocytes obtained from the related identified protein and plotted by MAProMa software. Specifically, proteins are plotted according to their theoretical isoelectric point (pI) and molecular weight (MW KDa), and the color/shape code for each identified protein is related to its identification confidence by SEQUEST score value (yellow/triangle <15, blue/square from >15 to <35, and red/circle >35). B) Differentially abundant proteins characterized through DAVE and DCI algorithms from MAProMa software (black/negative and grey/positive values correspond to up-regulated proteins in NSN and SN cells, respectively). C) Posttranslational modifications of peptides (acetylation, methylation, and deimination) in SN versus NSN oocytes.

