
Figure 2.
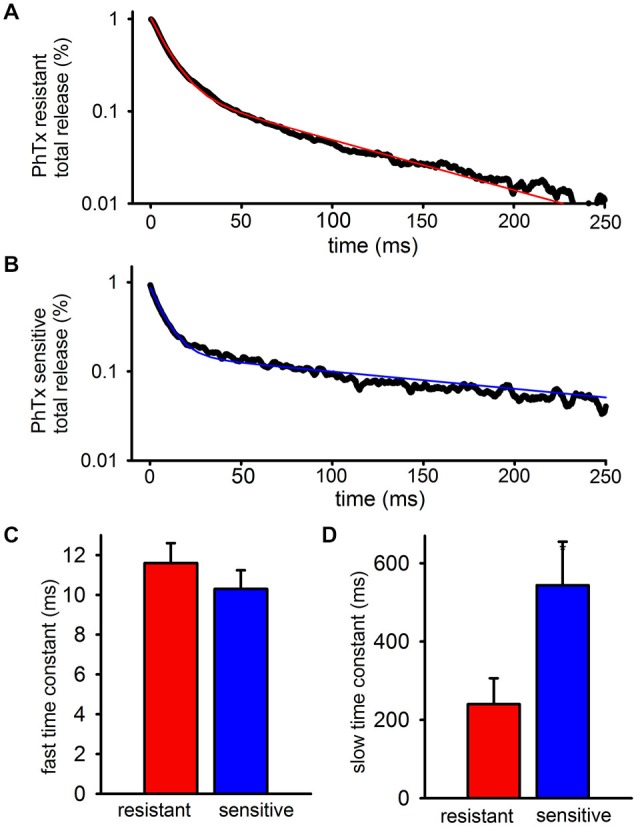
GluA2-lacking AMPARs contributing to the slow EPSC have slower decay kinetics than GluA2-containing AMPARs contributing to the slow EPSC. The PhTx- resistant and—sensitive currents after the final peak were isolated, fitted, and averaged. (A) Bi-exponential fit (red) plotted over representative data for a PhTx resistant current. (B) Bi-exponential fit (blue) plotted over representative data for a PhTx sensitive current. (C) Graph showing the average fast time constant is no different for PhTx resistant and sensitive currents. (D) Graph showing that the average slow time constant for the PhTx sensitive current is significantly faster than the resistant current.