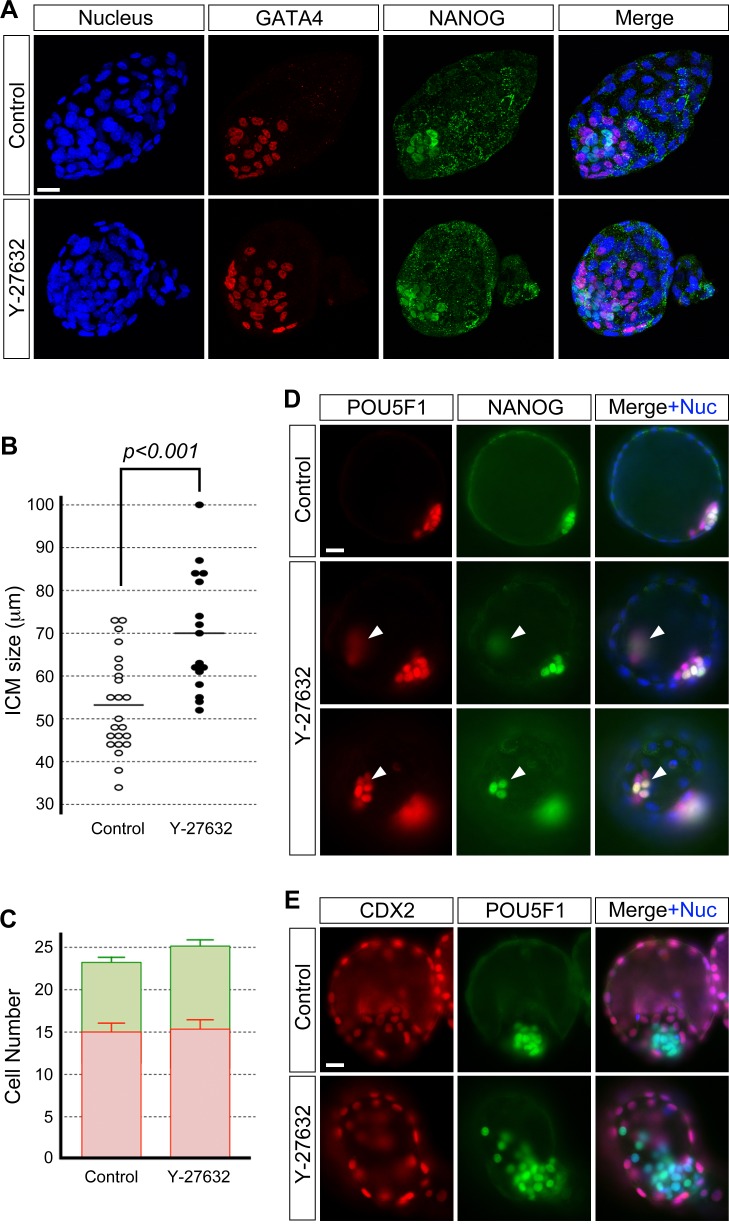
FIG. 5.
Disruption of the ICM morphology by Y-27632 (10 μM) treatment is not reversible. A) GATA4-positive PrE (red) and NANOG-positive Epi (green) cells appear more widely spread apart in the treated/washed blastocyst (E4.5+1day) than in the control blastocyst. Confocal images are z-series projections. B) Comparison of ICM size of blastocysts (E4.5+1day) based on the widest length of ICM cell dispersion. Circles represent the ICM size in individual embryos, and horizontal bars represent the mean value for each group. The ICM is significantly wider (Student t-test) in treated/washed embryos (n = 16) than in control embryos (n = 23). C) Comparison of the number of PrE (red bar) and Epi (green bar) cells shows no statistically significant differences (P[PrE] = 0.83, P[Epi] = 0.22; Student t-test) between control (n = 24) and treated/washed (n = 21) embryos. Graph shows the mean and standard error. Data presented in B and C are compilations of two replicates of the experiment that were performed on different occasions. D) Fluorescence microscopic images of blastocysts (E4.5+1day) immunostained for pluripotency markers. Top row shows POU5F1-positive ICM (red) cells and a subset of NANOG-positive Epi (green) cells in the control blastocyst. Second and third rows show an ectopic clump of NANOG/POU5F1-positive cells (arrowhead) at different planes of focus in the treated/washed blastocyst. E) Fluorescence microscopic images of blastocysts (E4.5+1day). The treated/washed blastocyst shows no differences to the control blastocyst with respect to CDX2 (red) protein immunostaining of the TE nuclei. The ICM is immunostained for POU5F1 (green) protein. Note that ICM cells are scattered in the Y-27632-treated blastocyst. Blue, DAPI (for nuclear staining [+Nuc]). Bars = 20 μm (A, D, E).

