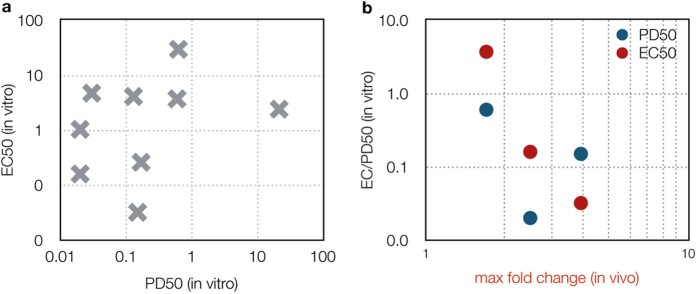
Figure 3. Correlation between pharmacodynamic parameters.

(a) The half-maximal pharmacodynamic response (PD50) from in vitro experiments was plotted versus the EC50 value from viability assays for the cell lines listed in Supplementary Table S1. (b) The maximum fold change in foci formation in vivo (x-axis) is plotted versus the half-maximal pharmacodynamic response (PD50, blue) or versus the EC50 (red) from viability assays.
