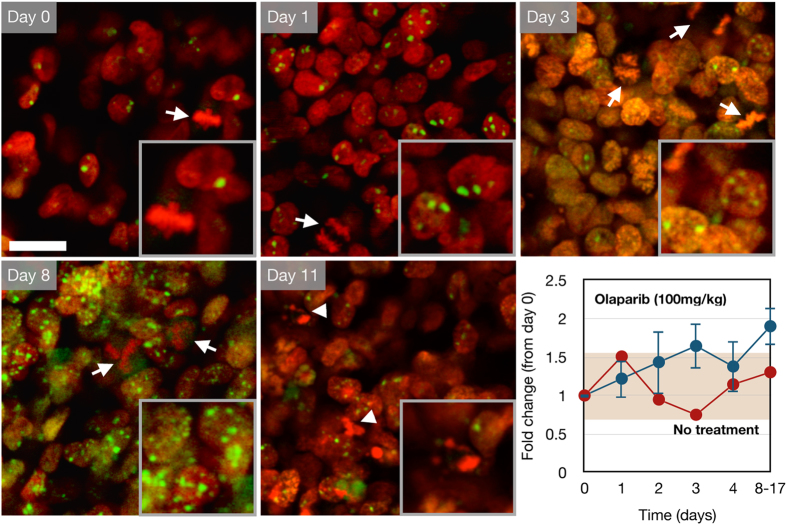
Figure 5. Serial in vivo imaging of a nu/nu mouse with a MHH-ES1 Ewing’s sarcoma tumor expressing the 53BP1trunc-Apple (green) and H2B-GFP (red) reporter.
The mouse was dosed daily with 100 mg/kg olaparib by IP injection (blue curve, n = 3) or vehicle (10% DMAC/Solutol in PBS, n = 1). Days 8–17 indicate pooled data from mice imaged on different days after olaparib treatment. Dividing cells (arrow) and apoptotic cells (arrowhead) were observed using the H2B-GFP (red) reporter. Error bars represent the standard error of the mean. Scale bar = 20 μm (inset magnified 1.7-fold).

