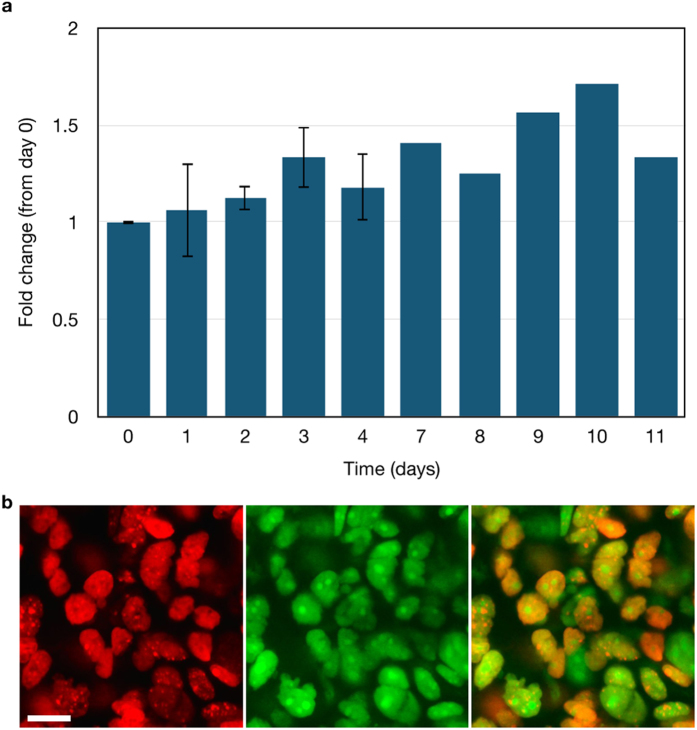
Figure 8. In vivo quantification of the fold change in foci formation in HCC1937 53BP1trunc-Apple cells grown in nude mice.
(a) The fold change in the number of foci was determined relative to day 0 of treatment with 100 mg/kg olaparib. Error bars represent the standard error of the mean for n = 2 mice. (b) Olaparib-Bodipy FL nuclear uptake in a nu/nu mouse with an HCC1937 tumor. The 53BP1trunc-Apple reporter (red nuclei, left) was imaged 2 hrs after IV administration of olaparib-Bodipy FL (green, center). Images from the 53BP1trunc-Apple (red) channel and the olaparib-Bodipy FL (green) channel were overlaid (merge, right) to show that olaparib-Bodipy FL accumulates in all HCC1937 tumor cell nuclei. Scale bar = 20 μm.

