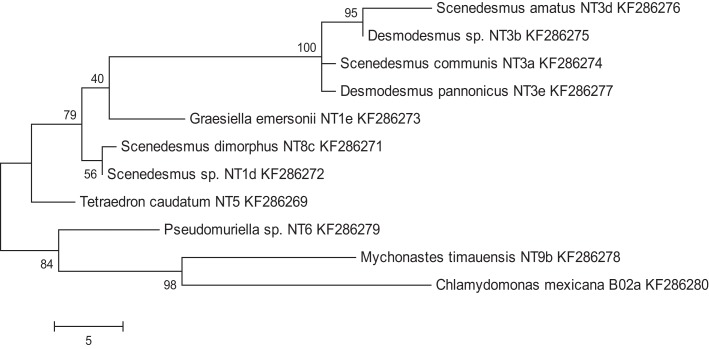
Figure 2.
Maximum parsimony analysis of taxa of isolated microalgae. Shown are genus, species (if applicable), and strain names, as well as Genbank entry accession numbers. The most parsimonious tree with a length of 96 is shown. The consistency index was 0.761905, the retention index was 0.83871, and the composite index was 0.707661 and 0.639017 for all sites and parsimony-informative sites, respectively. The percentage of replicate trees in which the associated taxa clustered together in the bootstrap test (200 replicates) is shown next to the branches.

