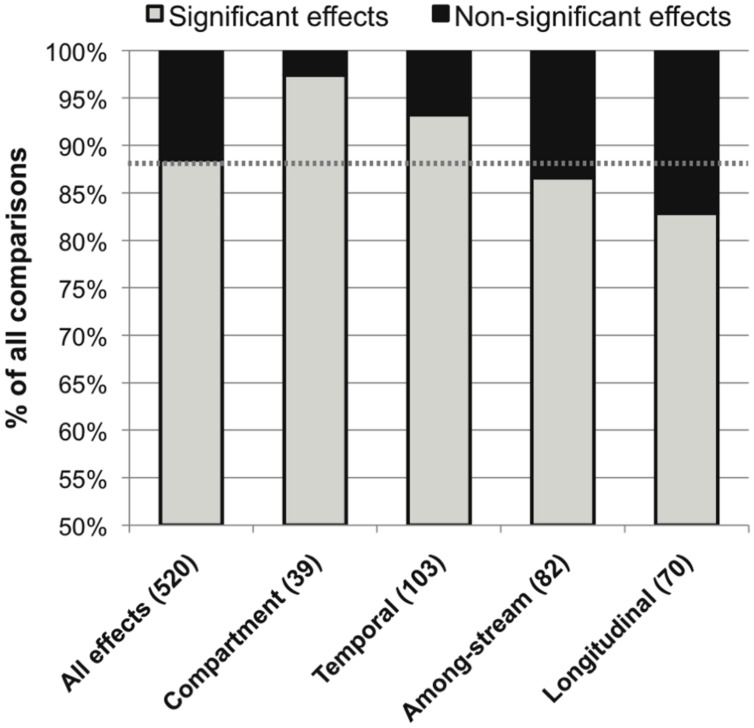
FIGURE 3.
Distribution of significant (in gray) and non-significant (in black) reported effects of categories of spatiotemporal variation on stream microbial diversity, with number of included studies noted for each category along the x-axis, and the percentage of significant effects for all comparisons combined noted as a dashed line for reference.

