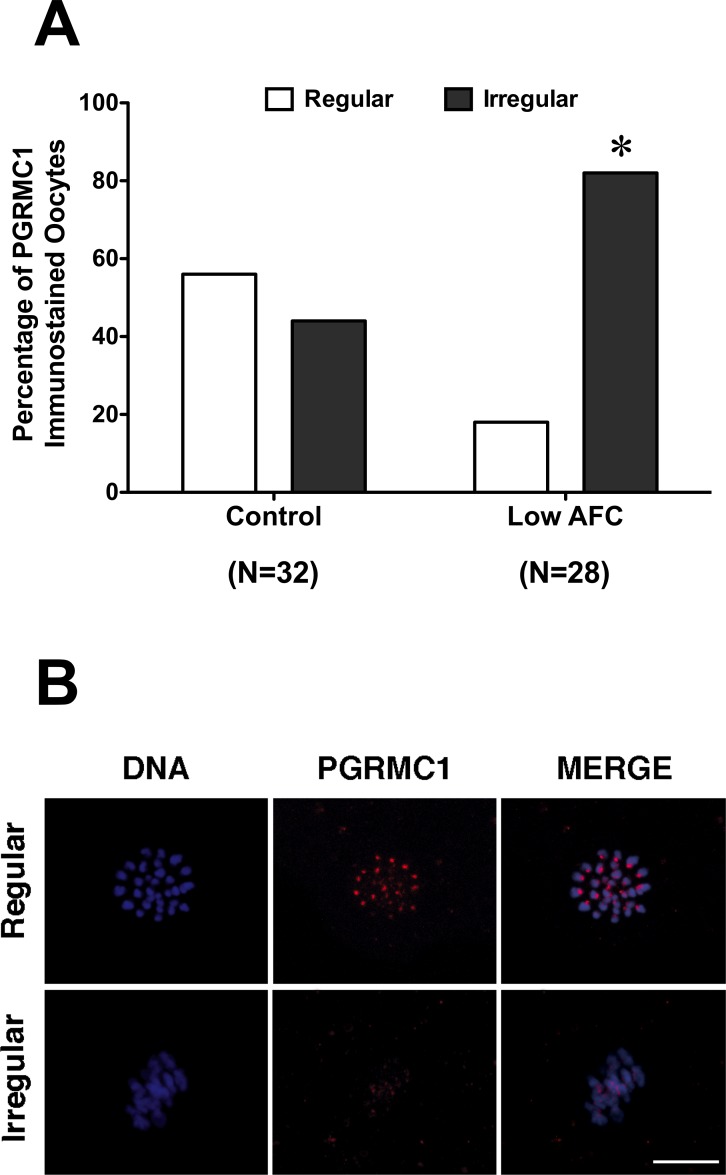
FIG. 3.
PGRMC1 localization in oocytes isolated from low AFC and age-matched control ovaries. A) Percentage of oocytes isolated from control and low antral follicle count ovaries showing regular and irregular PGRMC1 localization. Data were analyzed by the Fisher exact test (*P < 0.05). B) Representative images of regular and irregular localization of PGRMC1 in MII-stage oocytes. Blue, DNA; red, PGRMC1. Bar = 10 μm.

