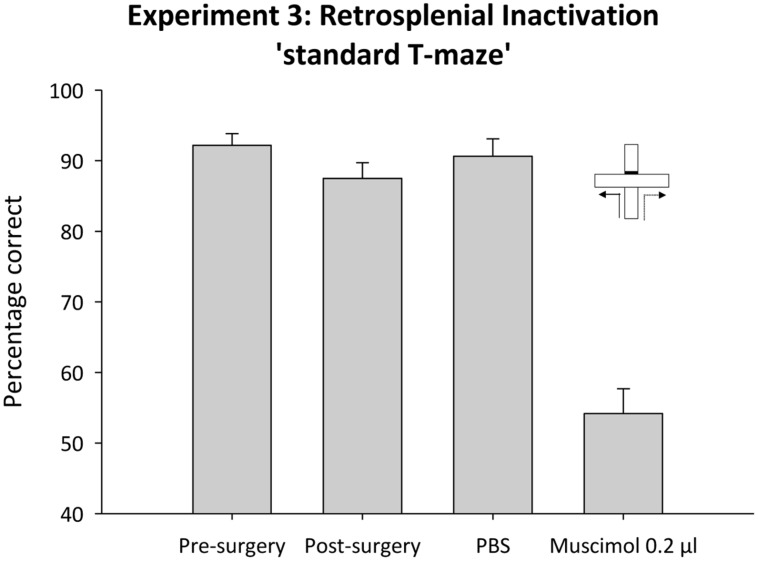
FIGURE 9.
Experiment 3. Standard T-maze alternation and retrosplenial cortex inactivation. The bar graph depicts the mean percentage correct responses across the six sessions of acquisition (pre-surgery) and performance in subsequent single sessions (post-surgery, control infusion and 0.2 μl muscimol infusion). Error bars refer to ±SEM.

