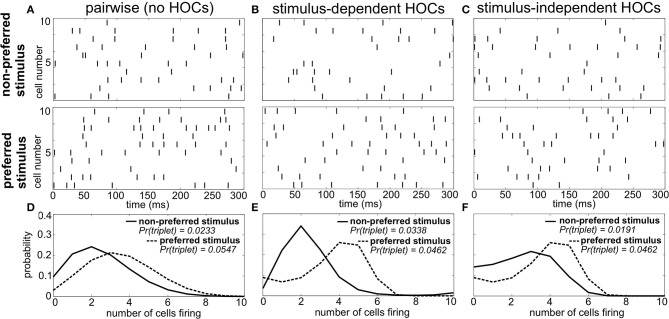
Figure 1.
Population spike responses in three examples with different higher-order correlations. (A–C) Raster plots for three sample populations in response to two stimuli (parameters are indicated in Figure 3A). All three populations have identical firing rates and pairwise correlations, and differ solely in the level of higher-order correlations. (A) The “pairwise” model, which can be fully described by the firing rates and pairwise correlations. In (B), the probability of three neurons spiking simultaneously has been increased (decreased) compared to the pairwise model in response to the non-preferred (preferred) stimulus. In (C), the probability of such triplet spiking is decreased for both stimuli. (D–F) Histograms of population spike count within 20 ms time bins for the three populations. Note how triplet correlations impact the skew of these response distributions (see text).

