
Figure 10.
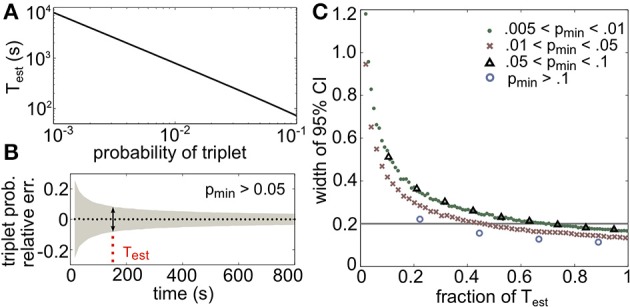
Amount of data necessary to accurately estimate triplet frequencies. In all panels, α = 0.1 (this represents the prescribed relative error; see text). (A) Test scales as a power law for small probabilities; here it is plotted in seconds, assuming 20 ms time bins. (B) Triplet probabilities were estimated from samples of 1000 triplet maximum entropy models with randomly chosen interaction parameters using different amounts of simulated data. Black dotted line shows the average relative error for all triplets with frequency greater than pmin = 0.05 as a function of time used in the estimation (assuming 20 ms time bins). Gray funnel represents the 95% confidence interval. Dotted red line shows Test calculated from Equation (14). As expected, the width of the confidence interval here (denoted by the arrows) is 2α = 0.2. (C) Width of 95% confidence interval (CI) plotted as a fraction of Test for four choices of pmin. All widths are below 2α by time T = Test.