
Figure 2.
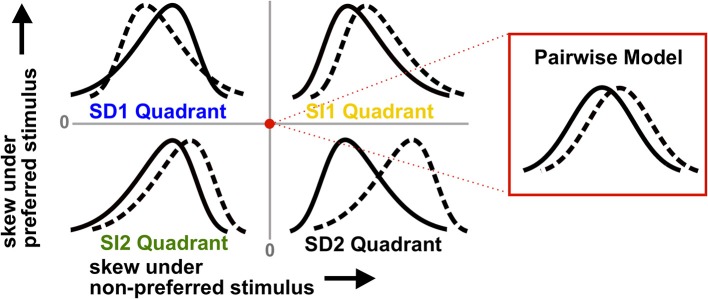
Schematic illustrating how triplet correlations skew population spike count distributions. Each quadrant corresponds to a different case of stimulus-dependent (SD) or stimulus-independent (SI) triplet spike correlations. The means and variances of the distributions are the same for all four quadrants; only the skew differs (and higher moments). The red dot represents the null pairwise model (which has zero skew). In particular, note that the distributions are pulled away from each other when the non-preferred response (solid line) is positively skewed and the preferred stimulus (dashed line) is negatively skewed (i.e., the SD2 quadrant). This case gives the largest coding advantage (see text).