
Figure 3.
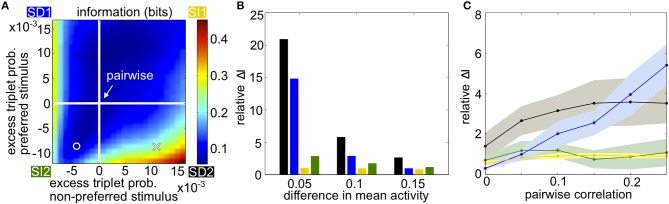
Populations with homogenous statistics. (A) Mutual information in bits as the excess triplet probability is varied for responses to the preferred and non-preferred stimuli. White lines indicate the pairwise maximum entropy model under each stimulus (shown in Figure 1A). The cross marker indicates the population in Figure 1B; circular marker for Figure 1C. Quadrants are labeled corresponding to the different stimulus-dependent triplet correlations (see Figure 2). In this example, the firing rate μ1 = 0.25 for the non-preferred stimulus, μ2 = 0.35 for the preferred stimulus, and the pairwise correlation ρ = 0.05 for both stimuli. (B) Relative increase in mutual information for the full model compared to the pairwise fit (see text), averaged over populations with firing rates between 0.1 and 0.35 but keeping Δμ fixed to 0.05, 0.10, or 0.15. Pairwise correlations are fixed to ρ = 0.05. Colors correspond to the corners of the quadrants indicated in (A) (blue, SD1; yellow, SI1, etc.). (C) Relative increase in mutual information as a function of pairwise noise correlations, averaged over different firing rates. Shading represents standard deviation over single-cell activity, ranging from 0.1 to 0.35 with step sizes of 0.05.