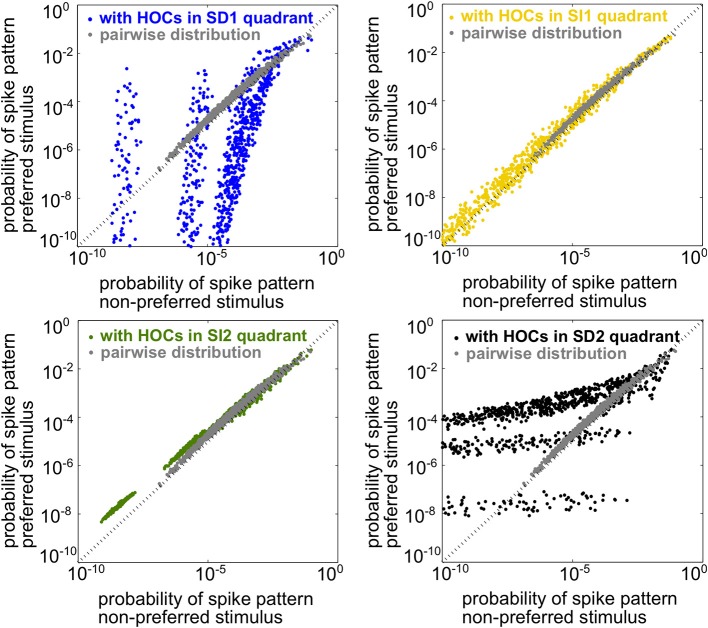
Figure 4.
Illustration of stimulus discriminability based on spike patterns in a heterogeneous neural population. Each point represents a different spiking pattern either for the pairwise model (gray, same model for all panels) or one with triplet correlations from one of the four quadrants in Figure 3A. The firing rates and pairwise correlations are identical for all five populations. The axes represent the probability of that spiking pattern under each stimulus. The triplet statistics drawn from quadrants SD1 and SD2 lead to better stimulus discrimination, since the points lie far from the identity line (see text).

