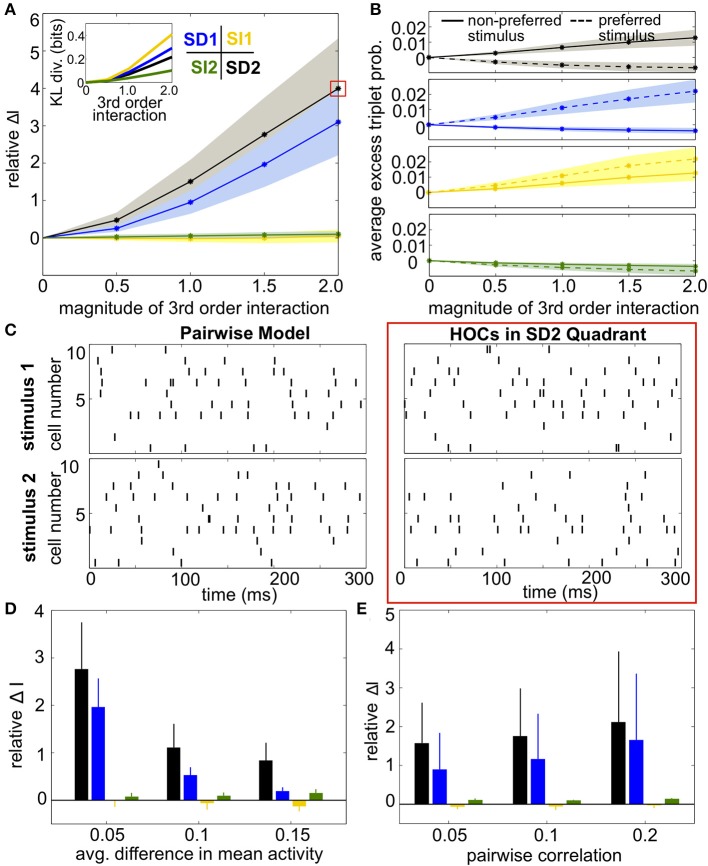
Figure 8.
Impact of triplet correlations on stimulus coding for populations with heterogeneous spiking statistics and different stimulus tuning for subgroups of cells. (A) Relative increase in information ΔI, averaged across 24 populations with different single-cell and pairwise statistics. ΔI is plotted against the magnitude of the third order interactions |G(m)ijk|, as the magnitudes of these interactions increase within the four different quadrants (see text). Note that stronger triplet interaction terms than in Figure 5A are required to have an effect on information because fewer triplets are varied in this case. Colors correspond to the quadrants indicated in Figure 3A. Average discrimination accuracy over the 24 pairwise models is 60%. The average correlation coefficient is 0.05 and the average difference between the probability of a spike under each stimulus is 0.05. The inset shows the average Kullback-Leibler divergence in bits between the triplet models and their pairwise maximum entropy fits. (B) Excess triplet probability for the non-preferred (solid lines) and preferred (dashed lines) stimuli, averaged over all triplets. (C) Raster plots for the population marked with a red box in (A), and the pairwise model. Note that the triplet correlations do not create large population-wide events immediately apparent by eye. (D) Relative increase in information over varying Δμ with average correlation of ρ = 0.05. The average baseline firing rate (to the non-preferred stimulus) was fixed to 0.05. (E) Relative increase in information as a function of average pairwise correlation. Here, the triplet interaction term is fixed to a magnitude of 1.5. Values are averaged over all firing rates (see Materials and Methods, Heterogeneous Populations). All error bars and shading represent standard deviation.

