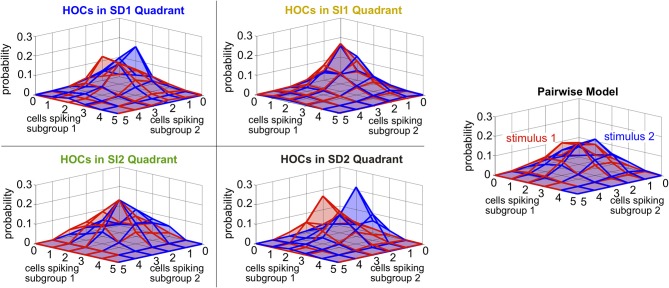
Figure 9.
Spike count histograms for five sample populations with dissimilar stimulus tuning, all of which share the same inhomogenous lower-order statistics. Panels show the pairwise model, right, (in which G(m) = 0) and the four different quadrants of triplet interactions, left, (G(m) = ±2.0). Parameters are taken from the red box in Figure 8 but are reduced from probabilities of spiking patterns to spike counts. In particular, the average pairwise correlation coefficient is 0.05 and the average difference between the probability of a spike under each stimulus is 0.05.

