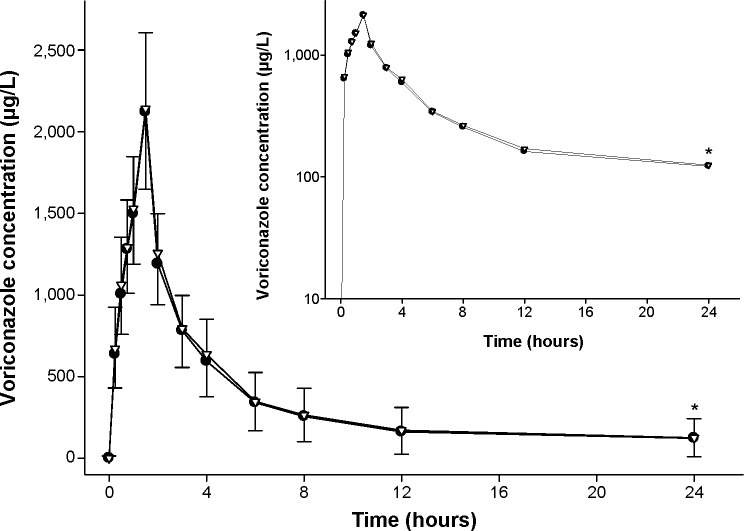
Figure 1.
Mean plasma concentration–time profiles of voriconazole after a single intravenous infusion at 200 mg over 1.5 hours.
Notes: SYP-1018 (•) or Vfend® (▽). The error bars represent the standard deviations (downward: SYP-1018; upward: Vfend®); inset: log-linear scale; *values at 24 hours post-dose were obtained in 33 subjects, excluding 19 subjects whose concentration was lower than the lower limit of quantification (25 μg/L).

