
Figure 1.
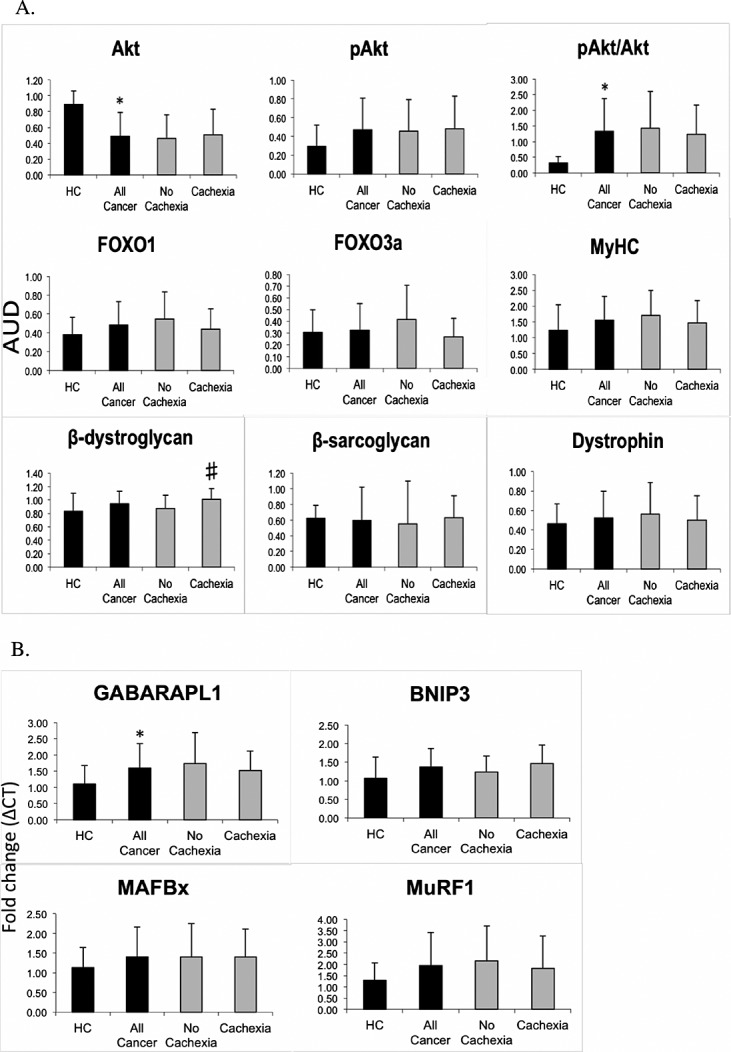
Graphs showing (A) densitometry of protein biomarkers normalised to loading control or (B) delta–delta (Δ) Threshold Cycle (CT) expression of mRNA biomarkers for healthy controls and cancer patients (with and without cachexia).
Official websites use .gov
A
.gov website belongs to an official
government organization in the United States.
Secure .gov websites use HTTPS
A lock (
) or https:// means you've safely
connected to the .gov website. Share sensitive
information only on official, secure websites.
Graphs showing (A) densitometry of protein biomarkers normalised to loading control or (B) delta–delta (Δ) Threshold Cycle (CT) expression of mRNA biomarkers for healthy controls and cancer patients (with and without cachexia).