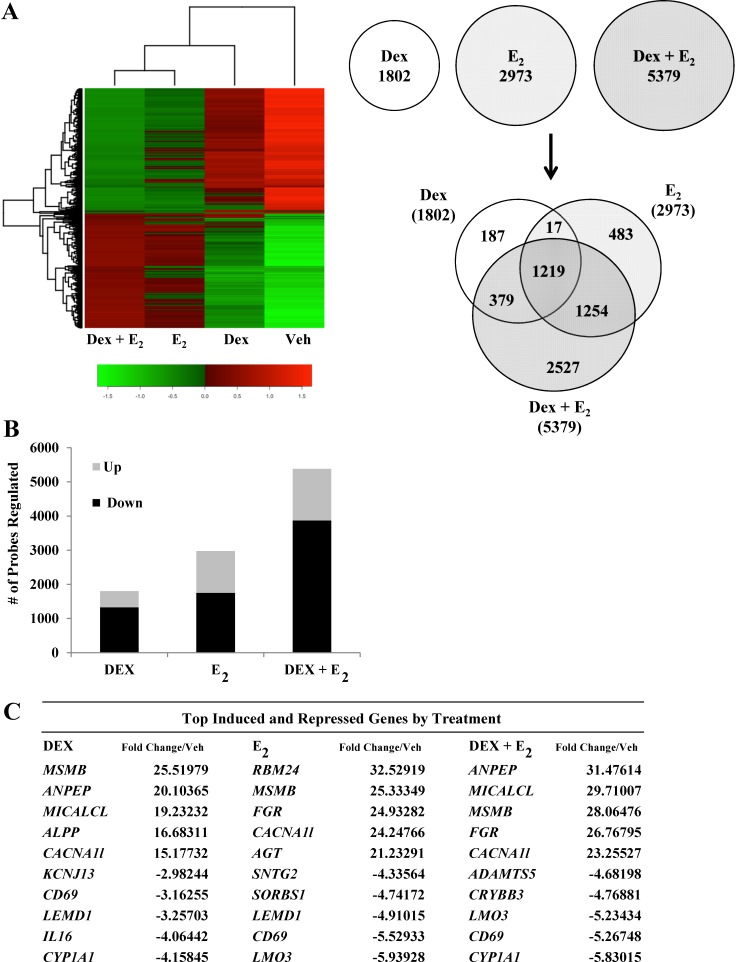
FIG. 1.
Dex and E2 regulate global gene expression in human uterine epithelial cells. A) mRNA isolated from Dex-, E2-, and Dex + E2-treated ECC1 cells was analyzed using Whole Human Genome 4x44 multiplex format oligo array (Agilent) for gene expression. A heat map was generated with Heatplus software (BioConductor), using the averaged, normalized sample replicates of all significant probes. The number of probes that were statistically different (P < 0.01) between treatment groups were sorted by Venn diagram. B) The number of probes that were regulated are organized as either induced or repressed according to treatment group in Dex, E2, and Dex + E2 samples. C) The top five induced and repressed genes for each treatment group are listed. D) IPA of the top five regulated networks using the gene lists generated from Dex-, E2-, and Dex + E2-treated ECC1 cells. E) Embryonic development and organ development network is presented, with expression values of the Dex, E2, and Dex + E2 treatment groups overlaid, as a colorimetric indicator of up- or down-regulation. F) Independent validation of Left-Right Determination Factor 1 (LEFTY1), one of the antagonized genes identified in the embryonic development and organ development network. Values were normalized to the housekeeping gene Cyclophilin B. Bar graphs show means ± SEM. **Groups with statistically different means at P < 0.01, as determined by ANOVA.

