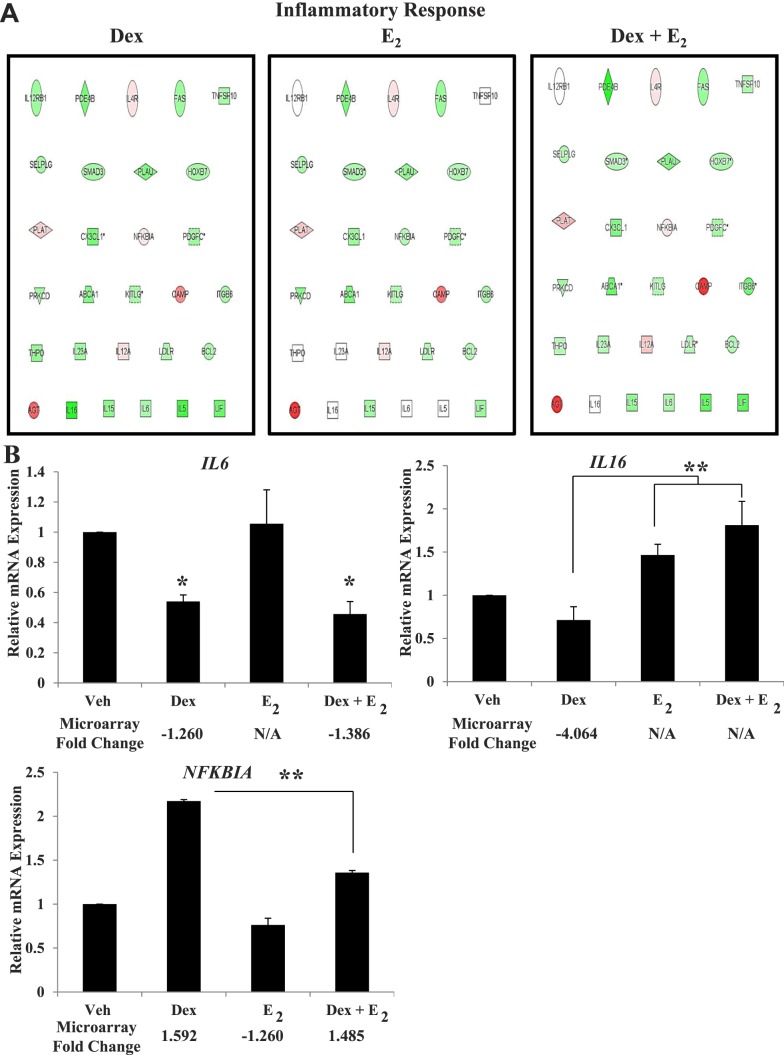
FIG. 2.
Inflammatory response genes demonstrate differential response to Dex and E2. A) IPA identified regulated genes in the inflammatory response pathway. The expression values for each treatment are overlaid on the gene ID. Colors represent direction and degrees of regulation, red indicating up-regulation and green indicating down-regulation. B) mRNA expression was determined for Interleukin 6 (IL6), Interleukin 16 (IL16) and Nuclear Factor of Kappa Light Polypeptide Gene Enhancer in B-cells Inhibitor Alpha (NFκBIA) in four independent biological replicates. Values were normalized to those of the housekeeping gene Cyclophilin B. Bar graphs show means ± SEM, and the fold change value determined by microarray is listed below each treatment (N/A = no change compared to vehicle). Statistically significant at *P < 0.05 and ** P < 0.01, as determined by ANOVA.

