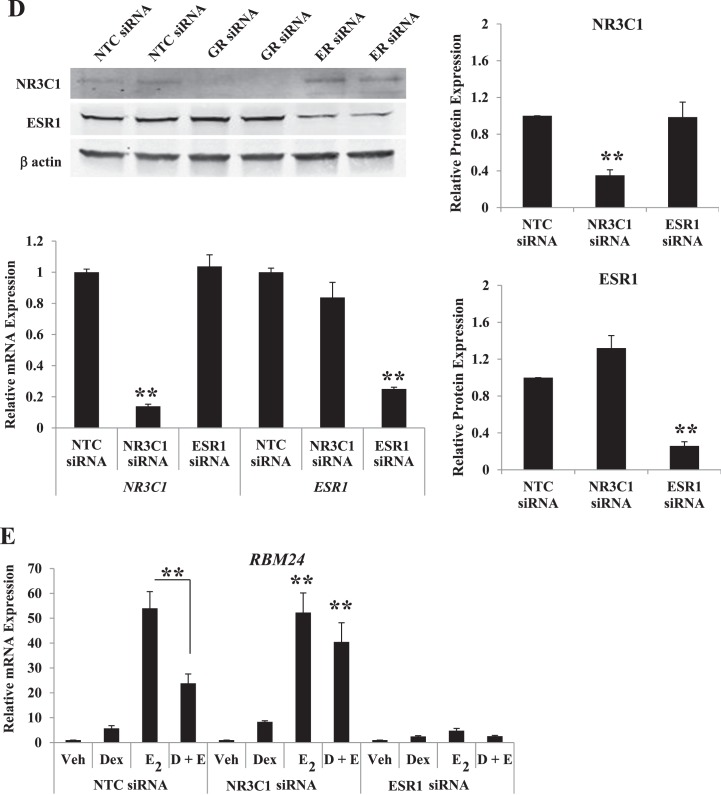
FIG. 5. cont.
Factor 1 (LEFTY1), and Chromosome 10 Open Reading Frame 10 (C10orf10). Values were normalized to those of PPIB. Bar graphs show means ± SEM of four biological replicates. Statistical significance at *P < 0.05 and **P < 0.01, as determined by ANOVA. D) Extent of receptor knockdown of ECC1 cells (transfected for 72 h with glucocorticoid receptor, estrogen receptor-alpha, or nontargeting control [NTC] siRNA) as assessed by QPCR was compared to that found by Western blotting. Values were normalized to those of the housekeeping genes PPIB (by QPCR) or ACTB (by Western blotting). Western blots present two representative biological replicates, and bar graphs show means ± SEM of four independent biological replicates. Statistical differences at **P < 0.01, as determined by ANOVA. E) ECC1 cells transfected with NTC, glucocorticoid receptor, or estrogen receptor-alpha siRNA were treated for 6 h with vehicle, Dex, E2, or Dex + E2, and mRNA expression levels of RBM24, LEFTY1, and C10orf10 were evaluated. Values were normalized to those of PPIB. Bar graphs show the means ± SEM of four biological replicates. The symbol Statistical differences at **P < 0.01, as determined by ANOVA.

