Figure 2.
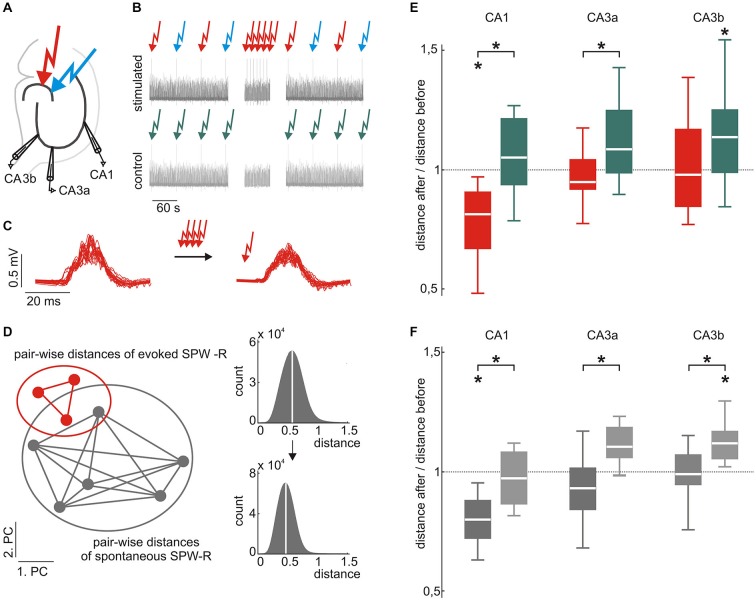
Evoked and spontaneous SPW-R waveforms are stabilized by low frequency stimulation. (A) Scheme of the electrode positions. Recording electrodes were located in CA3a, CA3b, and CA1. Two different locations in the dentate gyrus (DG) were electrically stimulated to evoke SPW-R complexes. (B) Scheme of the stimulation paradigm (top) and the control (bottom). Red and blue arrows indicate electrical stimulation at two different locations in the DG. Low-frequency repetitive stimulation (100 stimuli every 10 s, middle part) was only performed at one of the locations. Under control conditions, stimulation was paused instead for 1000 s. (C) Example of evoked SPW-R before (left) and after (right) repetitive stimulation. (D) Homogeneity of evoked and spontaneous SPW-R was quantified by the median intra-group pair-wise Euclidian distance in the 10-dimensional PC space. Smaller median distances indicate more similar waveforms. (E) Evoked SPW-R waveforms in CA1 became more similar after repetitive stimulation (red; median 0.81, 25th 0.66, 75th 0.90, p < 0.05, n = 8), whereas events under control conditions did not (green; median 1.05, 25th 0.93, 75th 1.21, n = 11 data sets from 7 slices), which resulted in a significant group difference (p < 0.01). Similarly, in CA3a we found a significant difference between both conditions (p < 0.05, repetitive stimulation: median 0.95, 25th 0.91, 75th 1.04, n = 8; control: median 1.08, 25th 0.98, 75th 1.25, n = 11 data sets from 6 slices). In CA3b repetitive stimulation (median 0.97, 25th 0.84, 75th 1.17, n = 12) prevented an increase of variability that was observed under control conditions (median 1.14, 25th 0.98, 75th 1.25, p < 0.05, n = 17 data sets from 9 slices). (F) Spontaneous events also showed a reduced variability after repetitive stimulation of evoked events as compared to control conditions (p < 0.05 for all subfields). Additionally, spontaneous events in CA1 became significantly less variable after repetitive stimulation (repetitive stimulation: median 0.80, 25th 0.72, 75th 0.88, p < 0.01, n = 10; control: median 0.97, 25th 0.86, 75th 1.08). Moreover, spontaneous events in CA3 became more diverse under control conditions (CA3a: median 1.10, 25th 1.06, 75th 1.18, p = 0.075, n = 6; CA3b: median 1.12, 25th 1.06, 75th 1.17, p < 0.01, n = 9), which was inhibited by 100 repetitive stimulations (CA3a: median 0.93, 25th 0.84, 75th 1.02; CA3b: median 0.99, 25th 0.95, 75th 1.07). “*” means that the finding is significant (p < 0.05).

