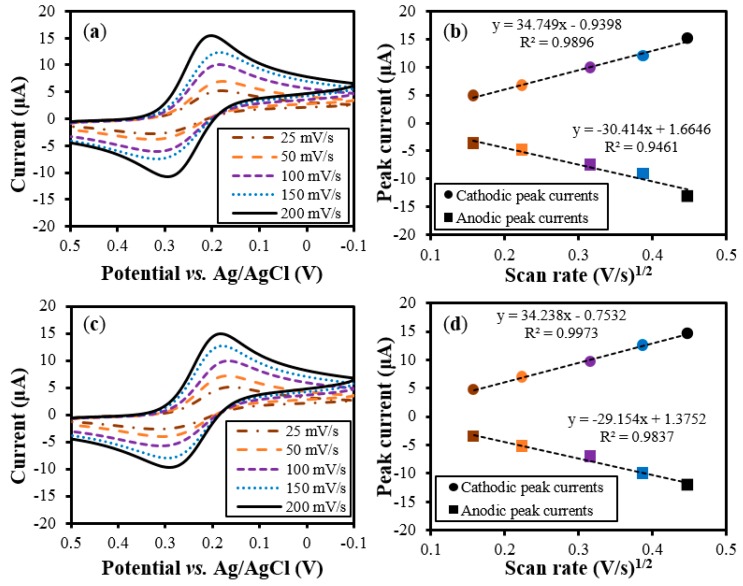
Figure 7.
Comparison of the CV curves of the ORE and SSRE for scan rates of 25, 50, 100, 150 and 200 mV/s. (a) and (b) are the CV curves for the ORE (plotted for comparison), and (c) and (d) are the curves for the SSRE. The solid circles (●) and boxes (■) in (b) and (d) stand for the cathodic and anodic peak currents, respectively. (The measurements were made three times. The error bars for the values were not shown as the difference in the currents was smaller than 0.5 μA.)

