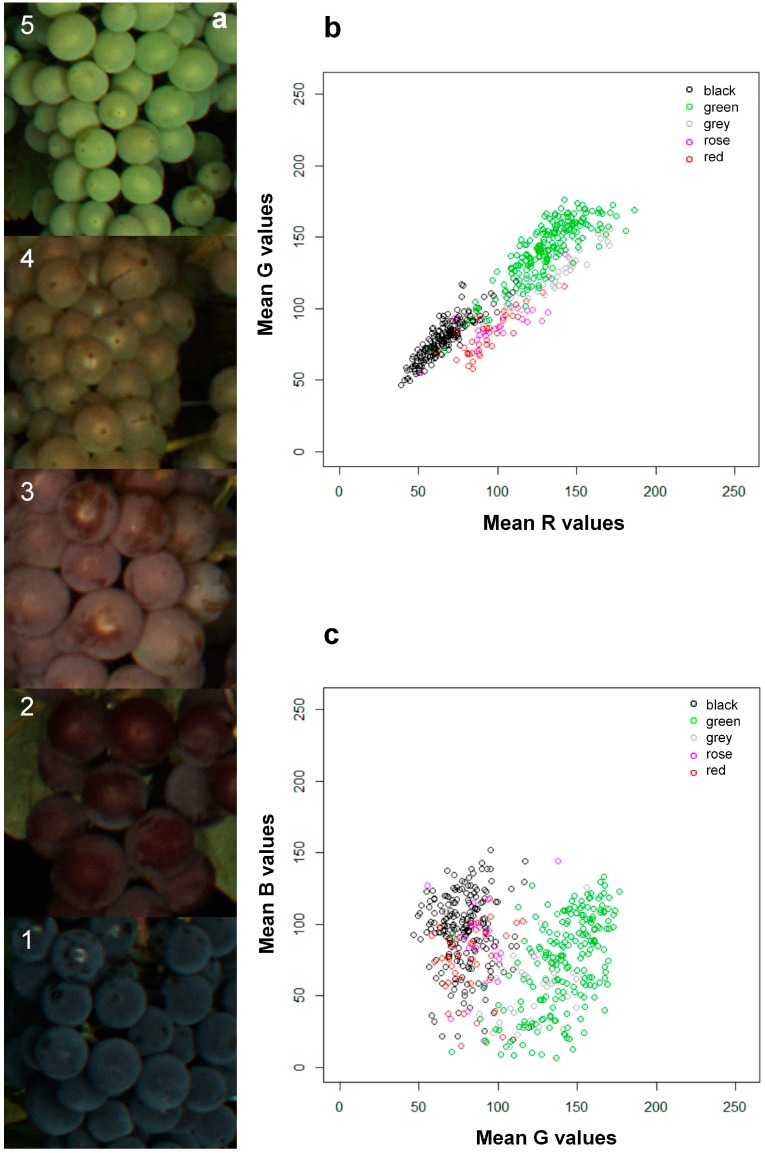
Figure 5.
Distance plots of single RGB values indicating the fitness of the color model used for LDA. Prediction of berry color classes was done using the image-based detected RGB values. LDA used three parameters (red, green and blue color values) and, as the ground truth, the visually assessed berry color. (a) Berry color was visually assessed as five classes: Class 1 = black; Class 2 = red; Class 3 = rose; Class 4 = grey; Class 5 = green; (b) distance plot of R values vs. G values; (c) distance plot of G values vs. B values.

